4-Hour Chart (Swing Context)
Trend: The BankNifty index is currently in an ascending channel formation after a prior downtrend.
Key Zone: The price is approaching the 55,600-55,800 supply zone, which is a significant resistance area.
Previous Break: The price has broken above the 54,400 level, which is now acting as a potential demand zone.
Bias: The overall momentum is bullish, but the price is currently within a major resistance zone.
1-Hour Chart (Intraday Context)
Structure: The price action is forming a clear pattern of higher highs and higher lows, indicating a bullish structure.
Support: The 54,400 level, which was previously resistance, is now acting as a support zone and showing strong bounces.
Current Action: The price is currently consolidating below the 55,600-55,800 supply zone. BOS: The buying order flow is still dominant, but the upside liquidity appears to be thinning.
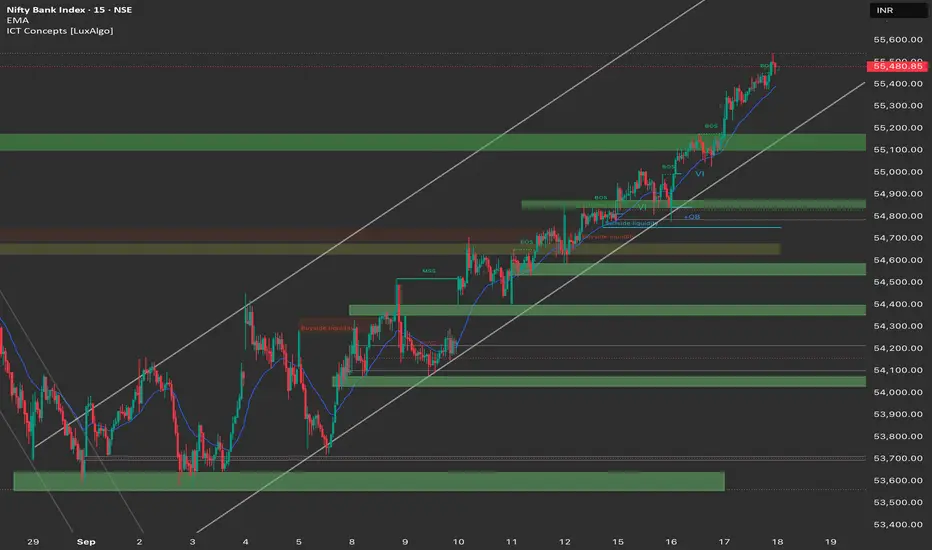
15-Minute Chart (Execution View)
Action: The price is in a sideways consolidation pattern below the 55,500 level.
OB: The order block around 54,400-54,500 is acting as a support buffer. FVG: Minor FVGs in the 54,800-54,900 zone may offer intraday support.
Channel: The price is respecting the ascending channel boundaries.
Trade Plan (18th September)
Bullish Scenario
Entry: Buy on a retracement towards the 54,400-54,500 demand zone (OB + structure support).
Targets:
TP1: 55,300 (intraday liquidity)
TP2: 55,600-55,800 (supply zone top & channel resistance)
Stop Loss: Below 54,300 (channel bottom & invalidation).
Bearish Scenario
Entry: Short on a rejection of the 55,600-55,800 supply zone with a strong bearish signal (e.g., engulfing candle).
Targets:
TP1: 55,000 (potential FVG fill)
TP2: 54,400-54,500 (major demand zone/OB)
Stop Loss: Above 55,800.
Bias: Neutral-to-Bullish. Expecting a potential pullback to 54,400-54,500 before a move towards the 55,600-55,800 resistance zone.
Caution: If the 54,400-54,500 demand zone fails to hold, expect a further downside acceleration towards 54,100-53,900.
Trend: The BankNifty index is currently in an ascending channel formation after a prior downtrend.
Key Zone: The price is approaching the 55,600-55,800 supply zone, which is a significant resistance area.
Previous Break: The price has broken above the 54,400 level, which is now acting as a potential demand zone.
Bias: The overall momentum is bullish, but the price is currently within a major resistance zone.
1-Hour Chart (Intraday Context)
Structure: The price action is forming a clear pattern of higher highs and higher lows, indicating a bullish structure.
Support: The 54,400 level, which was previously resistance, is now acting as a support zone and showing strong bounces.
Current Action: The price is currently consolidating below the 55,600-55,800 supply zone. BOS: The buying order flow is still dominant, but the upside liquidity appears to be thinning.
15-Minute Chart (Execution View)
Action: The price is in a sideways consolidation pattern below the 55,500 level.
OB: The order block around 54,400-54,500 is acting as a support buffer. FVG: Minor FVGs in the 54,800-54,900 zone may offer intraday support.
Channel: The price is respecting the ascending channel boundaries.
Trade Plan (18th September)
Bullish Scenario
Entry: Buy on a retracement towards the 54,400-54,500 demand zone (OB + structure support).
Targets:
TP1: 55,300 (intraday liquidity)
TP2: 55,600-55,800 (supply zone top & channel resistance)
Stop Loss: Below 54,300 (channel bottom & invalidation).
Bearish Scenario
Entry: Short on a rejection of the 55,600-55,800 supply zone with a strong bearish signal (e.g., engulfing candle).
Targets:
TP1: 55,000 (potential FVG fill)
TP2: 54,400-54,500 (major demand zone/OB)
Stop Loss: Above 55,800.
Bias: Neutral-to-Bullish. Expecting a potential pullback to 54,400-54,500 before a move towards the 55,600-55,800 resistance zone.
Caution: If the 54,400-54,500 demand zone fails to hold, expect a further downside acceleration towards 54,100-53,900.
Disclaimer
The information and publications are not meant to be, and do not constitute, financial, investment, trading, or other types of advice or recommendations supplied or endorsed by TradingView. Read more in the Terms of Use.
Disclaimer
The information and publications are not meant to be, and do not constitute, financial, investment, trading, or other types of advice or recommendations supplied or endorsed by TradingView. Read more in the Terms of Use.