🔎 Market Structure Analysis (BankNifty)
📍 Higher Timeframe (4H Chart)
Clear downtrend: Price broke structure (BOS) at 55,200 and failed to hold above 55,600–55,800 (OB + VI zone).
Trading well below 20 EMA, showing strong bearish momentum.
Currently sitting at 54,400–54,500 demand zone (last support before deeper fall).
Bias: Bearish as long as price stays under 55,000–55,200.
📍 Mid Timeframe (1H Chart)
Price respecting a down-channel with lower highs and lower lows.
FVG left around 54,900–55,200, which could act as a supply zone if retested.
Immediate support: 54,300–54,400.
Break below 54,300 opens room towards 53,800–54,000.
Bias: Sell rallies into 54,800–55,000; monitor 54,300 breakdown for continuation.
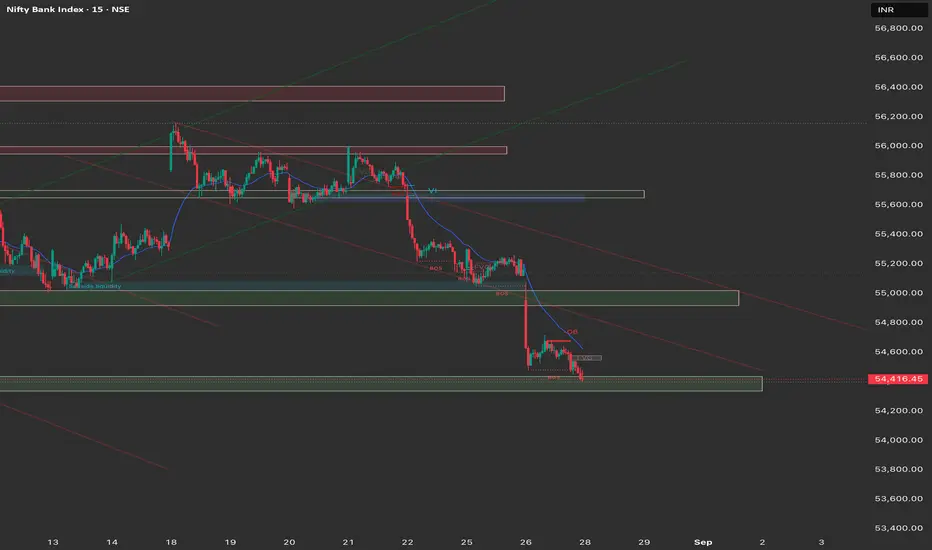
📍 Intraday View (15m Chart)
Order blocks and BOS visible around 54,750–54,800.
Multiple rejection wicks confirming supply around 54,700–54,900.
Currently consolidating at 54,400 with liquidity resting below.
Bias: Intraday short opportunities below 54,400; scalp long only if strong rejection from 54,300–54,400.
🎯 Trading Plan for 28th August
🔻 Short Plan (Primary Bias)
Entry Zone: 54,700–54,900 (Supply + FVG).
Stop Loss: Above 55,050.
Targets:
T1 = 54,400 (already tested, but scalpable)
T2 = 54,000
T3 = 53,800
🔺 Long Plan (Countertrend)
Entry Zone: 54,300–54,400 (Demand Zone).
Stop Loss: Below 54,150.
Targets:
T1 = 54,700
T2 = 54,900–55,000 (supply/FVG fill)
✅ Key Notes
Main structure = bearish; shorts are higher probability.
Longs = only if 54,300–54,400 holds with strong rejection on 15m + confirmation candle.
Break of 54,300 = free fall towards 53,800–54,000.
Volatility expected due to overlapping FVG + OB zones, so execution must be crisp.
📍 Higher Timeframe (4H Chart)
Clear downtrend: Price broke structure (BOS) at 55,200 and failed to hold above 55,600–55,800 (OB + VI zone).
Trading well below 20 EMA, showing strong bearish momentum.
Currently sitting at 54,400–54,500 demand zone (last support before deeper fall).
Bias: Bearish as long as price stays under 55,000–55,200.
📍 Mid Timeframe (1H Chart)
Price respecting a down-channel with lower highs and lower lows.
FVG left around 54,900–55,200, which could act as a supply zone if retested.
Immediate support: 54,300–54,400.
Break below 54,300 opens room towards 53,800–54,000.
Bias: Sell rallies into 54,800–55,000; monitor 54,300 breakdown for continuation.
📍 Intraday View (15m Chart)
Order blocks and BOS visible around 54,750–54,800.
Multiple rejection wicks confirming supply around 54,700–54,900.
Currently consolidating at 54,400 with liquidity resting below.
Bias: Intraday short opportunities below 54,400; scalp long only if strong rejection from 54,300–54,400.
🎯 Trading Plan for 28th August
🔻 Short Plan (Primary Bias)
Entry Zone: 54,700–54,900 (Supply + FVG).
Stop Loss: Above 55,050.
Targets:
T1 = 54,400 (already tested, but scalpable)
T2 = 54,000
T3 = 53,800
🔺 Long Plan (Countertrend)
Entry Zone: 54,300–54,400 (Demand Zone).
Stop Loss: Below 54,150.
Targets:
T1 = 54,700
T2 = 54,900–55,000 (supply/FVG fill)
✅ Key Notes
Main structure = bearish; shorts are higher probability.
Longs = only if 54,300–54,400 holds with strong rejection on 15m + confirmation candle.
Break of 54,300 = free fall towards 53,800–54,000.
Volatility expected due to overlapping FVG + OB zones, so execution must be crisp.
Disclaimer
The information and publications are not meant to be, and do not constitute, financial, investment, trading, or other types of advice or recommendations supplied or endorsed by TradingView. Read more in the Terms of Use.
Disclaimer
The information and publications are not meant to be, and do not constitute, financial, investment, trading, or other types of advice or recommendations supplied or endorsed by TradingView. Read more in the Terms of Use.