Detailed Market Structure Breakdown
4-Hour Chart (Macro Trend)
Structure: The long-term trend remains bullish. The index has now corrected to test the lower end of its ascending channel and has found support. The bounce from this area on Monday is a strong signal that the overall uptrend is still intact.
Key Levels:
Major Supply (Resistance): 55,800 - 56,000. This level has proven to be a very strong supply zone, rejecting the price on its recent attempt. It is now a critical resistance to watch.
Major Demand (Support): The most crucial support for the bulls is the 55,050 - 55,200 zone. This area, which includes a prior breakout level, is the key "line in the sand" for the current bullish trend. A strong bounce from this area would confirm the trend's continuation.
1-Hour Chart (Intermediate View)
Structure: The 1H chart shows a clear MSS (Market Structure Shift) to the downside. The price had broken below the lower trendline of the rising channel, but Monday's session saw a strong rebound, bringing it back into the channel's vicinity. The index is now at a crucial decision point.
Key Levels:
Immediate Resistance: The 55,800 level, which is the high of the recent bounce.
Immediate Support: The 55,400 area, which is the bottom of the previous consolidation and the lower channel trendline.
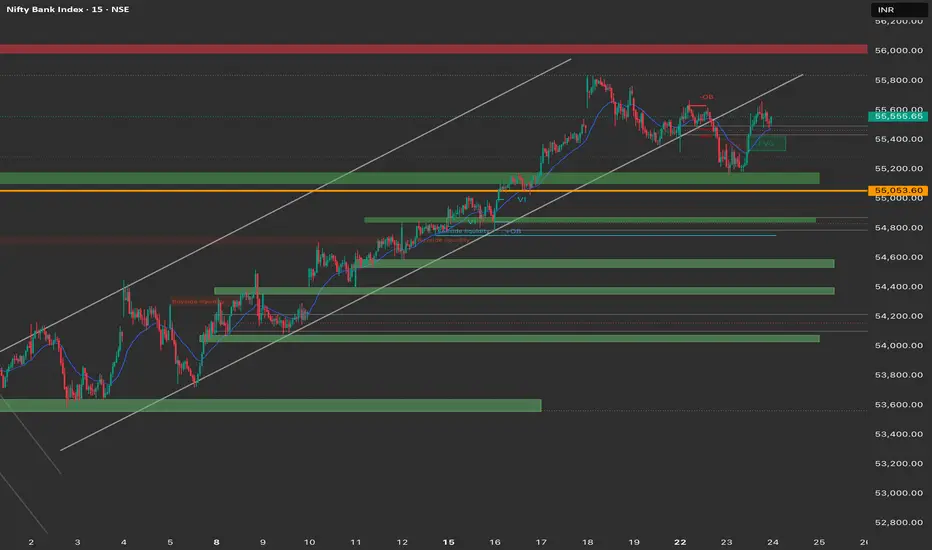
15-Minute Chart (Intraday View)
Structure: The 15M chart provides a clearer picture of the intraday price action. The index opened with a sharp move down but then rallied strongly, reclaiming its lost ground. The price is now trading within a corrective pattern, but the bullish momentum from the close is a positive sign.
Key Levels:
Intraday Supply: The 55,800 area, which is the high of Monday's session.
Intraday Demand: The low of Monday's session near 55,200.
Outlook: The intraday bias is now cautiously bullish, but the market is still in a corrective pattern. The key for today is to watch for a sustained move above or below the current consolidation range.
Trade Plan (Tuesday, 24th September)
Market Outlook: The market is now at a crucial decision point. While the recent bounce is bullish, the overall short-term structure is still in a corrective phase. A breakout from the recent consolidation would provide a clear signal.
Bullish Scenario (Primary Plan)
Justification: The market has shown a strong rebound from a key support area, suggesting that the long-term trend is likely to continue.
Entry: Look for a long entry on a sustained break and 15-minute candle close above the 55,800 resistance zone.
Stop Loss (SL): Place a stop loss below 55,700.
Targets:
T1: 56,000 (Psychological level and major resistance).
T2: 56,200 (Further extension of the rally).
Bearish Scenario (Counter-Trend Plan)
Justification: This is a counter-trend plan and should be approached with caution. It is based on the possibility that the bounce was short-lived and that the overall correction will continue.
Trigger: A confirmed breakdown and 15-minute candle close below the 55,400 immediate support.
Entry: Short entry on a breakdown retest of the 55,400 level.
Stop Loss (SL): Above 55,500.
Targets:
T1: 55,200 (Intraday support).
T2: 55,050 (Major demand zone).
Key Levels for Observation:
Immediate Decision Point: The 55,400 - 55,800 zone.
Bullish Confirmation: A break and sustained move above 55,800.
Bearish Confirmation: A break below 55,400.
Line in the Sand: The 55,050 - 55,200 zone. The overall bullish trend is in jeopardy if this level is decisively broken.
4-Hour Chart (Macro Trend)
Structure: The long-term trend remains bullish. The index has now corrected to test the lower end of its ascending channel and has found support. The bounce from this area on Monday is a strong signal that the overall uptrend is still intact.
Key Levels:
Major Supply (Resistance): 55,800 - 56,000. This level has proven to be a very strong supply zone, rejecting the price on its recent attempt. It is now a critical resistance to watch.
Major Demand (Support): The most crucial support for the bulls is the 55,050 - 55,200 zone. This area, which includes a prior breakout level, is the key "line in the sand" for the current bullish trend. A strong bounce from this area would confirm the trend's continuation.
1-Hour Chart (Intermediate View)
Structure: The 1H chart shows a clear MSS (Market Structure Shift) to the downside. The price had broken below the lower trendline of the rising channel, but Monday's session saw a strong rebound, bringing it back into the channel's vicinity. The index is now at a crucial decision point.
Key Levels:
Immediate Resistance: The 55,800 level, which is the high of the recent bounce.
Immediate Support: The 55,400 area, which is the bottom of the previous consolidation and the lower channel trendline.
15-Minute Chart (Intraday View)
Structure: The 15M chart provides a clearer picture of the intraday price action. The index opened with a sharp move down but then rallied strongly, reclaiming its lost ground. The price is now trading within a corrective pattern, but the bullish momentum from the close is a positive sign.
Key Levels:
Intraday Supply: The 55,800 area, which is the high of Monday's session.
Intraday Demand: The low of Monday's session near 55,200.
Outlook: The intraday bias is now cautiously bullish, but the market is still in a corrective pattern. The key for today is to watch for a sustained move above or below the current consolidation range.
Trade Plan (Tuesday, 24th September)
Market Outlook: The market is now at a crucial decision point. While the recent bounce is bullish, the overall short-term structure is still in a corrective phase. A breakout from the recent consolidation would provide a clear signal.
Bullish Scenario (Primary Plan)
Justification: The market has shown a strong rebound from a key support area, suggesting that the long-term trend is likely to continue.
Entry: Look for a long entry on a sustained break and 15-minute candle close above the 55,800 resistance zone.
Stop Loss (SL): Place a stop loss below 55,700.
Targets:
T1: 56,000 (Psychological level and major resistance).
T2: 56,200 (Further extension of the rally).
Bearish Scenario (Counter-Trend Plan)
Justification: This is a counter-trend plan and should be approached with caution. It is based on the possibility that the bounce was short-lived and that the overall correction will continue.
Trigger: A confirmed breakdown and 15-minute candle close below the 55,400 immediate support.
Entry: Short entry on a breakdown retest of the 55,400 level.
Stop Loss (SL): Above 55,500.
Targets:
T1: 55,200 (Intraday support).
T2: 55,050 (Major demand zone).
Key Levels for Observation:
Immediate Decision Point: The 55,400 - 55,800 zone.
Bullish Confirmation: A break and sustained move above 55,800.
Bearish Confirmation: A break below 55,400.
Line in the Sand: The 55,050 - 55,200 zone. The overall bullish trend is in jeopardy if this level is decisively broken.
Disclaimer
The information and publications are not meant to be, and do not constitute, financial, investment, trading, or other types of advice or recommendations supplied or endorsed by TradingView. Read more in the Terms of Use.
Disclaimer
The information and publications are not meant to be, and do not constitute, financial, investment, trading, or other types of advice or recommendations supplied or endorsed by TradingView. Read more in the Terms of Use.