🔵 BankNifty Analysis (as of 28th July close)
🧠 Market Context
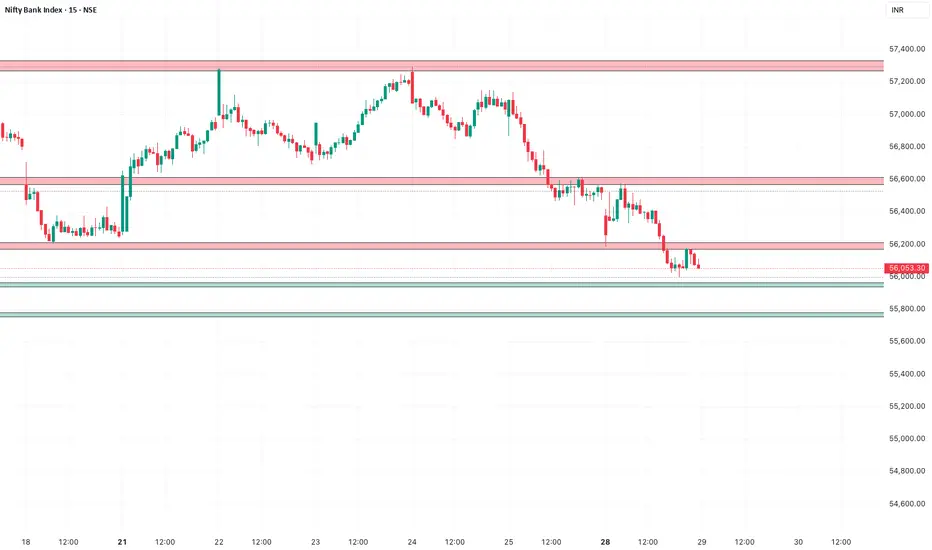
Price is currently around 56,050, sitting right on a key demand support zone between 56,000–56,200.
The higher timeframe (4H & 1H) structure remains bearish, with a series of lower highs and lower lows.
Price has broken below the mid-range support (56,200) and is retesting it.
If this zone fails, the next strong demand is near 55,800–55,900.
Supply zones above remain heavy, especially between 56,600–57,200.
📌 Market Structure (4H & 1H Combined)
Trend Bias: Bearish
4H:
Lower highs and lower lows intact.
Strong supply overhead at 57,000–57,300.
Demand holding weakly at 56,000–56,200.
1H:
Price consolidating at demand after a sharp sell-off.
No sign of a reversal yet; bounce attempts look corrective.
🗺️ Key Zones
Immediate Resistance (Supply)
56,600–56,800 (minor supply)
57,000–57,200 (major supply)
Immediate Support (Demand)
56,000–56,200 (current demand; being tested)
55,800–55,900 (next strong demand)
No Trade Zone
Between 56,200–56,400 → choppy, whipsaw risk.
📈 Trade Plan
Scenario 1 – Sell on Pullback (Preferred Bias)
Entry: Near 56,400–56,500 on rejection (15min bearish pattern)
SL: Above 56,650
Targets: 56,000 → 55,850
Scenario 2 – Breakdown Sell
If 56,000 breaks with volume
Entry: 55,950
SL: Above 56,200
Targets: 55,800 → 55,650
Scenario 3 – Countertrend Buy (Aggressive)
Only if 56,000 demand shows strong rejection with 15min bullish engulfing
Entry: 56,050–56,100
SL: Below 55,900
Targets: 56,400 → 56,600
(Low probability, high risk — not preferred unless clear confirmation).
✅ Bias for Tomorrow: Sell on rallies towards 56,400–56,500 unless strong demand rejection appears at 56,000.
🧠 Market Context
Price is currently around 56,050, sitting right on a key demand support zone between 56,000–56,200.
The higher timeframe (4H & 1H) structure remains bearish, with a series of lower highs and lower lows.
Price has broken below the mid-range support (56,200) and is retesting it.
If this zone fails, the next strong demand is near 55,800–55,900.
Supply zones above remain heavy, especially between 56,600–57,200.
📌 Market Structure (4H & 1H Combined)
Trend Bias: Bearish
4H:
Lower highs and lower lows intact.
Strong supply overhead at 57,000–57,300.
Demand holding weakly at 56,000–56,200.
1H:
Price consolidating at demand after a sharp sell-off.
No sign of a reversal yet; bounce attempts look corrective.
🗺️ Key Zones
Immediate Resistance (Supply)
56,600–56,800 (minor supply)
57,000–57,200 (major supply)
Immediate Support (Demand)
56,000–56,200 (current demand; being tested)
55,800–55,900 (next strong demand)
No Trade Zone
Between 56,200–56,400 → choppy, whipsaw risk.
📈 Trade Plan
Scenario 1 – Sell on Pullback (Preferred Bias)
Entry: Near 56,400–56,500 on rejection (15min bearish pattern)
SL: Above 56,650
Targets: 56,000 → 55,850
Scenario 2 – Breakdown Sell
If 56,000 breaks with volume
Entry: 55,950
SL: Above 56,200
Targets: 55,800 → 55,650
Scenario 3 – Countertrend Buy (Aggressive)
Only if 56,000 demand shows strong rejection with 15min bullish engulfing
Entry: 56,050–56,100
SL: Below 55,900
Targets: 56,400 → 56,600
(Low probability, high risk — not preferred unless clear confirmation).
✅ Bias for Tomorrow: Sell on rallies towards 56,400–56,500 unless strong demand rejection appears at 56,000.
Disclaimer
The information and publications are not meant to be, and do not constitute, financial, investment, trading, or other types of advice or recommendations supplied or endorsed by TradingView. Read more in the Terms of Use.
Disclaimer
The information and publications are not meant to be, and do not constitute, financial, investment, trading, or other types of advice or recommendations supplied or endorsed by TradingView. Read more in the Terms of Use.