🔎 Market Structure Analysis (Multi-Timeframe)
4H Chart (Swing Structure)
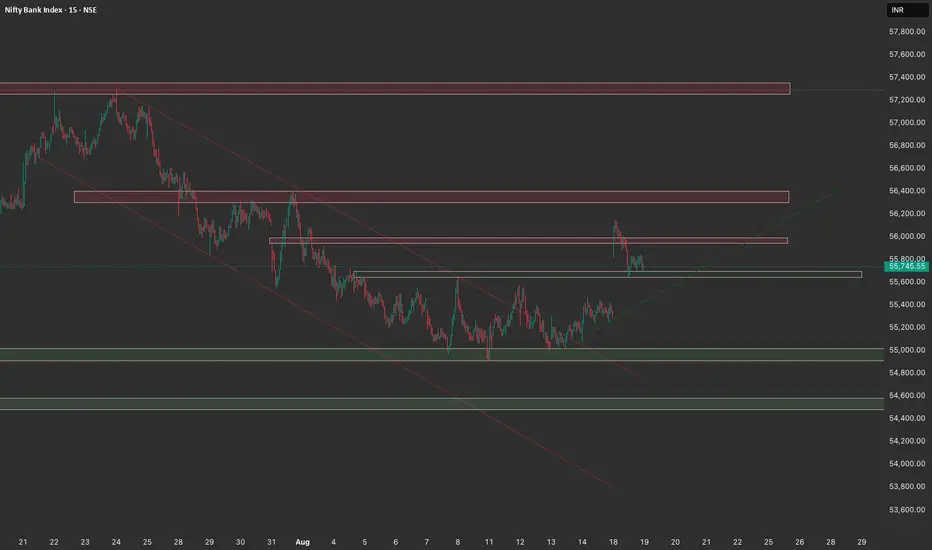
Trend: Price has broken out of the falling channel and is showing signs of reversal.
Current Zone: Trading around 55,700–55,800, facing resistance just above.
Supports:
55,400–55,500 → immediate support (recent breakout retest zone).
55,000–55,100 → strong demand zone (green block on chart).
54,600 → deeper swing support.
Resistances:
56,000–56,200 → immediate supply zone.
56,600–56,800 → next resistance.
57,200–57,400 → major supply.
👉 Structure is shifting bullish, but supply overhead is heavy.
1H Chart (Intraday Bias)
After breakout, price is consolidating above 55,600.
Forming higher lows, indicating buyers active on dips.
Resistance rejection seen near 55,900–56,000.
A break and close above 56,000 may open upside till 56,400.
15M Chart (Execution Levels)
Price is ranging 55,600–55,900.
Liquidity cluster visible above 56,000.
Support retest levels: 55,500–55,600.
If 55,500 fails, momentum may drag to 55,100–55,200.
📌 Trade Plan for Tomorrow
Bullish Scenario (Preferred)
Entry: On dips near 55,500–55,600 with bullish rejection.
Targets:
T1: 55,900–56,000
T2: 56,400
T3: 56,800
Stoploss: Below 55,400.
Bearish Scenario
Entry: If price rejects strongly from 56,000–56,200 zone.
Targets:
T1: 55,600
T2: 55,200
T3: 55,000
Stoploss: Above 56,300.
Key Notes
Tomorrow’s 55,500–56,000 zone will be a battle zone. Breakout or rejection here will set the intraday direction.
Bias: Slightly bullish above 55,500 but cautious till 56,000 is cleared.
Use price action confirmations (15m candles, rejections, engulfing patterns) before entry.
4H Chart (Swing Structure)
Trend: Price has broken out of the falling channel and is showing signs of reversal.
Current Zone: Trading around 55,700–55,800, facing resistance just above.
Supports:
55,400–55,500 → immediate support (recent breakout retest zone).
55,000–55,100 → strong demand zone (green block on chart).
54,600 → deeper swing support.
Resistances:
56,000–56,200 → immediate supply zone.
56,600–56,800 → next resistance.
57,200–57,400 → major supply.
👉 Structure is shifting bullish, but supply overhead is heavy.
1H Chart (Intraday Bias)
After breakout, price is consolidating above 55,600.
Forming higher lows, indicating buyers active on dips.
Resistance rejection seen near 55,900–56,000.
A break and close above 56,000 may open upside till 56,400.
15M Chart (Execution Levels)
Price is ranging 55,600–55,900.
Liquidity cluster visible above 56,000.
Support retest levels: 55,500–55,600.
If 55,500 fails, momentum may drag to 55,100–55,200.
📌 Trade Plan for Tomorrow
Bullish Scenario (Preferred)
Entry: On dips near 55,500–55,600 with bullish rejection.
Targets:
T1: 55,900–56,000
T2: 56,400
T3: 56,800
Stoploss: Below 55,400.
Bearish Scenario
Entry: If price rejects strongly from 56,000–56,200 zone.
Targets:
T1: 55,600
T2: 55,200
T3: 55,000
Stoploss: Above 56,300.
Key Notes
Tomorrow’s 55,500–56,000 zone will be a battle zone. Breakout or rejection here will set the intraday direction.
Bias: Slightly bullish above 55,500 but cautious till 56,000 is cleared.
Use price action confirmations (15m candles, rejections, engulfing patterns) before entry.
Disclaimer
The information and publications are not meant to be, and do not constitute, financial, investment, trading, or other types of advice or recommendations supplied or endorsed by TradingView. Read more in the Terms of Use.
Disclaimer
The information and publications are not meant to be, and do not constitute, financial, investment, trading, or other types of advice or recommendations supplied or endorsed by TradingView. Read more in the Terms of Use.