Based on the charts and the market's performance on Wednesday, October 15, the Bank Nifty experienced a strong, volatile session, successfully defending a key support and confirming the continuation of its short-term bullish trend.
Detailed Market Structure Breakdown
4-Hour Chart (Macro Trend)
Structure: The Bank Nifty is in a strong bullish uptrend. The market dipped sharply on Monday but found buying interest at the lower trendline of the ascending channel and the 55,800 - 56,000 demand zone. The strong bullish candle on Wednesday (Oct 15th) confirmed the Market Structure Shift (MSS) back to the upside, breaking the corrective trendline.
Key Levels:
Major Supply (Resistance): 57,000 - 57,200. This area is the immediate overhead hurdle, aligning with the upper trendline of the channel and the psychological 57,000 mark.
Major Demand (Support): 56,200 - 56,400. This area includes the lower trendline of the ascending channel and a prior FVG (Fair Value Gap), serving as the must-hold zone for the continuation of the rally.
Outlook: The short-term bias is strongly bullish. The market is poised to challenge the 57,000 resistance.
1-Hour Chart (Intermediate View)
Structure: The 1H chart shows a clear Break of Structure (BOS) on the upside. The price is trading within a steep ascending channel, having successfully retested and bounced off the lower channel trendline on the open.
Key Levels:
Immediate Resistance: 57,000.
Immediate Support: 56,600 (Recent swing low and FVG support).
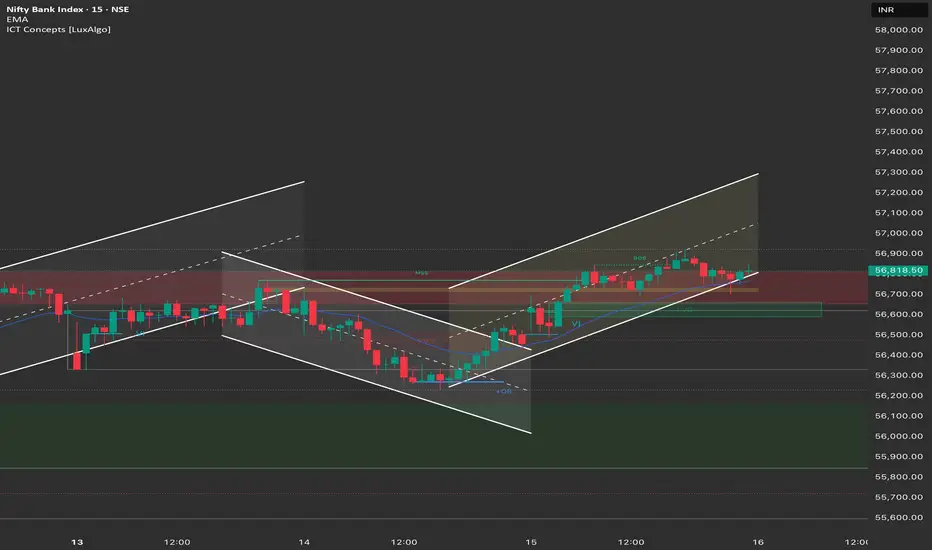
15-Minute Chart (Intraday View)
Structure: The 15M chart confirms the strong bullish momentum. The market closed right at the upper end of its intraday range, and is currently consolidating in a small bullish flag pattern. The price is trading above the upper boundary of the previous corrective channel.
Key Levels:
Intraday Supply: 57,000.
Intraday Demand: 56,600.
Outlook: Strongly Bullish.
📈 Trade Plan (Thursday, 16th October)
Market Outlook: The Bank Nifty is displaying strong bullish momentum and is positioned for a move toward the 57,000 psychological mark. The primary strategy will be to buy on continuation.
Bullish Scenario (Primary Plan)
Justification: The market has confirmed a strong reversal, and the sustained move within the ascending channel favors continuation toward the next major supply zone.
Entry: Long entry on a decisive break and 15-minute candle close above 57,000. Alternatively, look for a dip entry near 56,600 - 56,700 (the immediate support/FVG zone).
Stop Loss (SL): Place a stop loss below 56,400 (below the lower channel trendline).
Targets:
T1: 57,300 (Previous all-time high zone).
T2: 57,600 (Extension target).
Bearish Scenario (Counter-Trend Plan)
Justification: Only valid if there is sharp profit booking or negative news that causes the price to break the bullish structure.
Trigger: A decisive break and 1-hour candle close below 56,200.
Entry: Short entry below 56,200.
Stop Loss (SL): Above 56,500.
Targets:
T1: 55,800 (Major FVG support).
T2: 55,400 (Major demand zone).
Key Levels for Observation:
Immediate Decision Point: 56,800 - 57,000 zone.
Bullish Confirmation: A break and sustained move above 57,000.
Bearish Warning: A move below 56,400 suggests the rally is failing.
Major Event: Infosys, LTIMindtree, Wipro Q2 Results (will influence overall sentiment).
Line in the Sand: 56,200. Below this level, the short-term bullish bias is nullified.
Disclaimer
The information and publications are not meant to be, and do not constitute, financial, investment, trading, or other types of advice or recommendations supplied or endorsed by TradingView. Read more in the Terms of Use.
Disclaimer
The information and publications are not meant to be, and do not constitute, financial, investment, trading, or other types of advice or recommendations supplied or endorsed by TradingView. Read more in the Terms of Use.