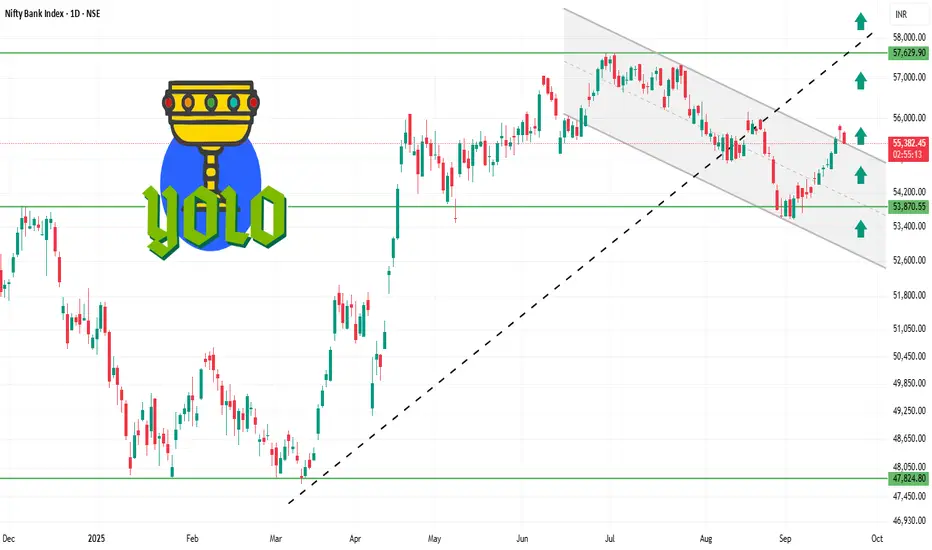
✅ Current Facts
Current Level: ~ 55,400 – 55,480
Trend: Mildly bullish; trading above short-term moving averages (20-day & 50-day EMA).
Momentum Indicators:
RSI (14-day): ~61 → bullish but not overbought.
MACD: Positive → supporting the upward trend.
Price Action: Daily candles show small upper wicks → minor profit-taking near resistance.
⚙️ Outlook
Bullish Scenario:
Holding above 55,350 → retest 55,550–55,600 and possibly 55,700–55,750.
Range / Consolidation:
Price oscillates between 55,350 – 55,550 → sideways trading likely.
Bearish Scenario:
Close below 55,350 → downside risk toward 55,150–55,200 or lower.
⚠️ Key Facts
55,400 – 55,500 is acting as a short-term pivot: above it favors bulls, below it favors bears.
Resistance at 55,550–55,600 is the first hurdle; breakout here can lead to further upside.
Support at 55,300–55,350 is critical; failing to hold may lead to short-term correction.
Related publications
Disclaimer
The information and publications are not meant to be, and do not constitute, financial, investment, trading, or other types of advice or recommendations supplied or endorsed by TradingView. Read more in the Terms of Use.
Related publications
Disclaimer
The information and publications are not meant to be, and do not constitute, financial, investment, trading, or other types of advice or recommendations supplied or endorsed by TradingView. Read more in the Terms of Use.