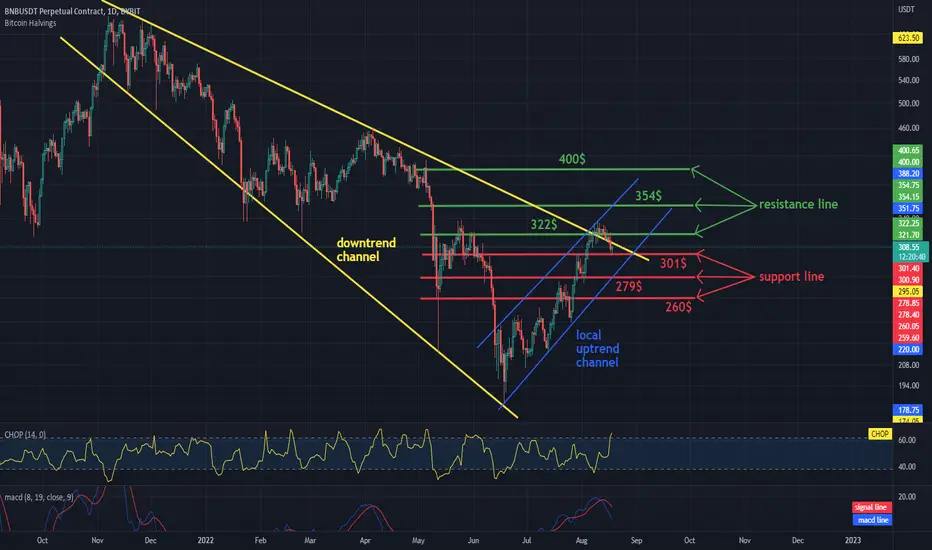
Hello everyone, let's take a look at the BNB to USDT chart over the 1 day timeframe. As you can see, we have been moving in the downtrend channel for a long time, while locally we are in an uptrend and in a place where we can try to break out of a long-term downward trend.
Let's start with the designation of the support line and as you can see the first support in the near future is $ 301, if the support breaks down, the next support is $ 279 and $ 260.
Now let's move from the resistance line, as you can see the first resistance we are currently struggling with is $ 322 breaking the first resistance will give us a potential exit from the long downturn channel, if we can break it, the next resistance will be $ 354 and $ 400.
Looking at the CHOP indicator, we can see that in the 1-day range we have a lot of energy, and the MACD indicator shows that we are in a downward trend locally.
Disclaimer
The information and publications are not meant to be, and do not constitute, financial, investment, trading, or other types of advice or recommendations supplied or endorsed by TradingView. Read more in the Terms of Use.
Disclaimer
The information and publications are not meant to be, and do not constitute, financial, investment, trading, or other types of advice or recommendations supplied or endorsed by TradingView. Read more in the Terms of Use.