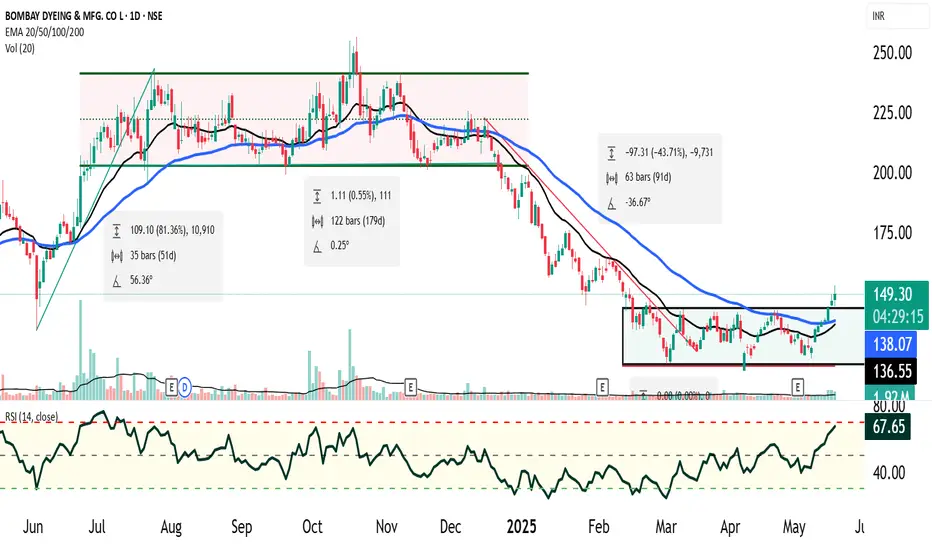
✅ 1. Markup Phase (4 June 2024 – 25 July 2024)
Price movement: ~80% rally.
1. RSI behavior: RSI stayed above neutral (never oversold), frequently nearing overbought.
2. Volume: Increasing — confirmation of strong upside momentum.
3. Participants: Smart money and institutions led the rally.
🚨 2. Distribution Phase (~6 Months)
Price action: Sideways movement in a 20% range
1. Volume: Likely choppy or decreasing, with spikes on down days — a classic distribution sign.
2. RSI: Range-bound between 40–60 — no trend, loss of momentum.
3. Participants: Institutions unloading to retail/inexperienced participants.
🔻 3. Markdown Phase
Breakdown: Support breached after distribution range.
1. Price movement: Dropped ~50% from support breakout.
2. RSI: Frequently oversold — sign of strong weakness.
3. Volume: Likely increased on down days — panic selling.
🧱 4. Accumulation Phase (Last 3 Months)
Price action: Consolidated in ~15% narrow range.
1. RSI: Did not touch oversold zone — indicates seller exhaustion.
2. Participants: Value investors, smart money slowly building positions.
3. Volume: Gradually increasing — early signs of interest.
🔔 Current Technical Signal (20 May 2025)
Breakout: Price has now closed above the resistance of the accumulation range.
Volume: Above-average — confirms breakout strength.
1. RSI: Approaching overbought zone — sign of bullish momentum returning.
2. Price is above 20 EMA and 50 EMA.
3. Expected bullish crossover or confirmation already happened.
📊 Interpretation: Strong Bullish Reversal in Progress
Smart money has likely finished accumulating. Breakout from the accumulation zone with volume, RSI trend, and moving average confirmations all suggest the early stage of a new markup phase is starting. This could be the start of a fresh uptrend or the first leg of a longer bullish swing, especially if:
✅ Actionable Steps (Not Financial Advice)
Entry:
Traders: Consider entry near breakout retest (if occurs).
Investors: Start building position gradually if long-term reversal is confirmed.
Risk Management:
Stop-loss: Just below the accumulation range (tight) or recent swing low (looser).
Position sizing based on volatility and risk appetite.
Targets:
Near-term: 15–20% move based on accumulation range height.
Medium-term: 50–80% potential if this is a true markup phase (mirroring last cycle).
Confirmation Factors:
If you'd like, I can also:
Draw a price cycle chart based on your description.
Help you draft a trade plan or investment thesis.
Pull recent news or updates on Bombay Dyeing (using live data).
Let me know how you'd like to proceed!
Price movement: ~80% rally.
1. RSI behavior: RSI stayed above neutral (never oversold), frequently nearing overbought.
2. Volume: Increasing — confirmation of strong upside momentum.
3. Participants: Smart money and institutions led the rally.
🚨 2. Distribution Phase (~6 Months)
Price action: Sideways movement in a 20% range
1. Volume: Likely choppy or decreasing, with spikes on down days — a classic distribution sign.
2. RSI: Range-bound between 40–60 — no trend, loss of momentum.
3. Participants: Institutions unloading to retail/inexperienced participants.
🔻 3. Markdown Phase
Breakdown: Support breached after distribution range.
1. Price movement: Dropped ~50% from support breakout.
2. RSI: Frequently oversold — sign of strong weakness.
3. Volume: Likely increased on down days — panic selling.
🧱 4. Accumulation Phase (Last 3 Months)
Price action: Consolidated in ~15% narrow range.
1. RSI: Did not touch oversold zone — indicates seller exhaustion.
2. Participants: Value investors, smart money slowly building positions.
3. Volume: Gradually increasing — early signs of interest.
🔔 Current Technical Signal (20 May 2025)
Breakout: Price has now closed above the resistance of the accumulation range.
Volume: Above-average — confirms breakout strength.
1. RSI: Approaching overbought zone — sign of bullish momentum returning.
2. Price is above 20 EMA and 50 EMA.
3. Expected bullish crossover or confirmation already happened.
📊 Interpretation: Strong Bullish Reversal in Progress
Smart money has likely finished accumulating. Breakout from the accumulation zone with volume, RSI trend, and moving average confirmations all suggest the early stage of a new markup phase is starting. This could be the start of a fresh uptrend or the first leg of a longer bullish swing, especially if:
Broader market supports cyclical or value stocks.
Company-specific fundamentals (earnings, business outlook) align with technical cues.
✅ Actionable Steps (Not Financial Advice)
Entry:
Traders: Consider entry near breakout retest (if occurs).
Investors: Start building position gradually if long-term reversal is confirmed.
Risk Management:
Stop-loss: Just below the accumulation range (tight) or recent swing low (looser).
Position sizing based on volatility and risk appetite.
Targets:
Near-term: 15–20% move based on accumulation range height.
Medium-term: 50–80% potential if this is a true markup phase (mirroring last cycle).
Confirmation Factors:
- Look for increasing volume in subsequent up candles.
- Weekly close above breakout zone.
- Fundamental support (news, earnings upgrade, insider buying, etc.).
If you'd like, I can also:
Draw a price cycle chart based on your description.
Help you draft a trade plan or investment thesis.
Pull recent news or updates on Bombay Dyeing (using live data).
Let me know how you'd like to proceed!
Disclaimer
The information and publications are not meant to be, and do not constitute, financial, investment, trading, or other types of advice or recommendations supplied or endorsed by TradingView. Read more in the Terms of Use.
Disclaimer
The information and publications are not meant to be, and do not constitute, financial, investment, trading, or other types of advice or recommendations supplied or endorsed by TradingView. Read more in the Terms of Use.