📈 Daily Technical Indicators
RSI (14-day): 57.72 — Indicates a neutral to bullish momentum.
MACD: -19.21 — Suggests mild bearishness.
Stochastic Oscillator: 83.13 — Approaching overbought territory, implying caution.
Average True Range (ATR): Indicates low volatility, suggesting a stable trading environment.
ADX (14-day): 26.07 — Reflects a moderately strong trend.
🔄 Short-Term Outlook
On the 1-hour chart, BSE Ltd. is exhibiting a "Strong Sell" signal across both technical indicators and moving averages. This suggests a prevailing short-term downtrend, with the stock trading below its key moving averages.
📊 Key Levels to Watch
Support Levels: ₹2,230 (recent low) and ₹2,121 (intraday low).
Resistance Levels: ₹2,281 (recent high) and ₹2,300 (target price set by IIFL Capital).
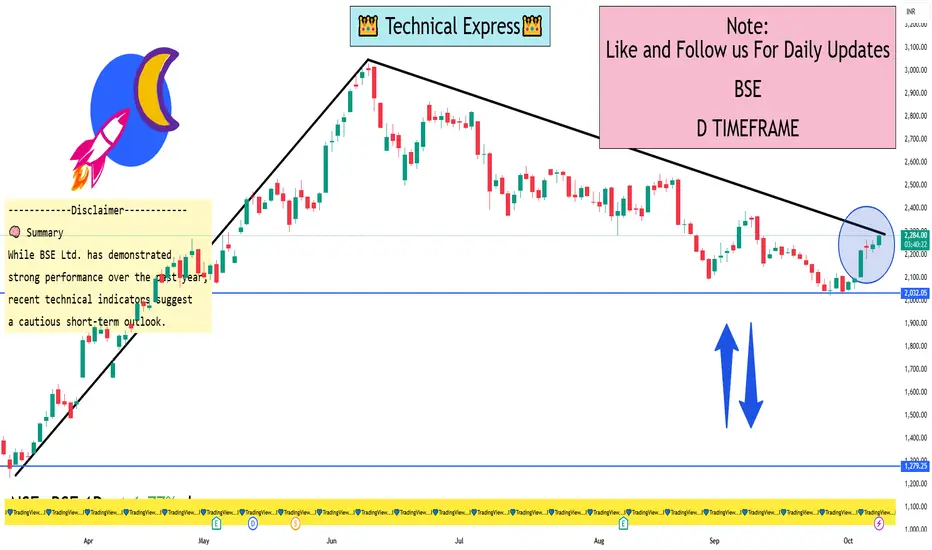
🧠 Summary
While BSE Ltd. has demonstrated strong performance over the past year, recent technical indicators suggest a cautious short-term outlook. Traders should monitor key support and resistance levels closely and consider market conditions before making investment decisions.
RSI (14-day): 57.72 — Indicates a neutral to bullish momentum.
MACD: -19.21 — Suggests mild bearishness.
Stochastic Oscillator: 83.13 — Approaching overbought territory, implying caution.
Average True Range (ATR): Indicates low volatility, suggesting a stable trading environment.
ADX (14-day): 26.07 — Reflects a moderately strong trend.
🔄 Short-Term Outlook
On the 1-hour chart, BSE Ltd. is exhibiting a "Strong Sell" signal across both technical indicators and moving averages. This suggests a prevailing short-term downtrend, with the stock trading below its key moving averages.
📊 Key Levels to Watch
Support Levels: ₹2,230 (recent low) and ₹2,121 (intraday low).
Resistance Levels: ₹2,281 (recent high) and ₹2,300 (target price set by IIFL Capital).
🧠 Summary
While BSE Ltd. has demonstrated strong performance over the past year, recent technical indicators suggest a cautious short-term outlook. Traders should monitor key support and resistance levels closely and consider market conditions before making investment decisions.
I built a Buy & Sell Signal Indicator with 85% accuracy.
📈 Get access via DM or
WhatsApp: wa.link/d997q0
| Email: techncialexpress@gmail.com
| Script Coder | Trader | Investor | From India
📈 Get access via DM or
WhatsApp: wa.link/d997q0
| Email: techncialexpress@gmail.com
| Script Coder | Trader | Investor | From India
Related publications
Disclaimer
The information and publications are not meant to be, and do not constitute, financial, investment, trading, or other types of advice or recommendations supplied or endorsed by TradingView. Read more in the Terms of Use.