🔎 Multi-Timeframe Market Structure
4H Chart
Price is still respecting the descending channel.
Recent rejection came right from the channel supply + OB zone ~81,600–81,800.
Support demand holds near 80,600–80,750, which has been tested multiple times.
Market is consolidating between 80,600–81,600.
Bias: Range-bound inside larger downtrend. Unless 81,800 breaks, structure remains corrective.
1H Chart
Clear swing high rejection at 81,600.
Price retraced to FVG + demand block around 80,700–80,800, and bounced.
Currently trading near 81,100–81,200 (mid-channel zone).
Liquidity pools visible above 81,600 (short-trap potential).
Bias: Intraday bullish bias from demand zones, but still capped by channel supply.
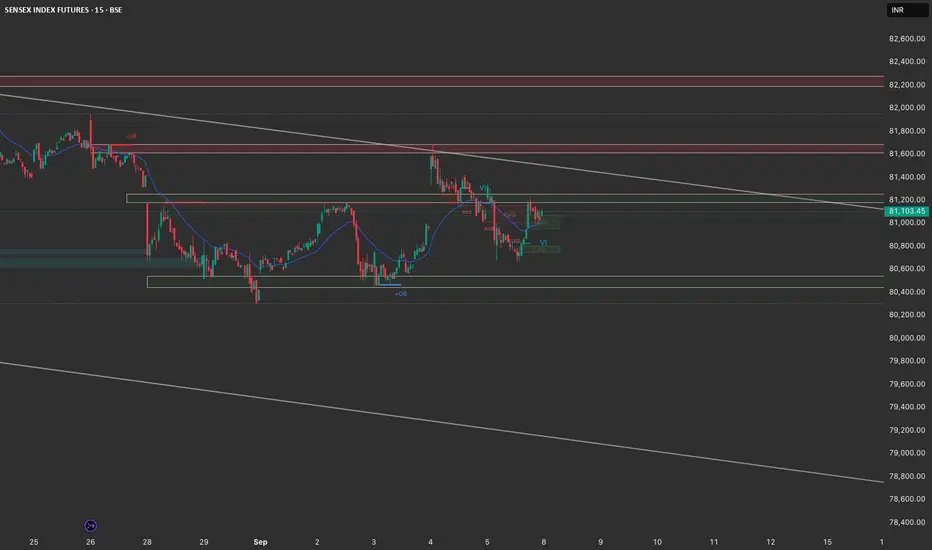
15M Chart
Short-term MSB → BOS → Retest seen near 80,700.
Price is consolidating just below minor resistance 81,200–81,300.
Imbalances (FVG) left around 80,900–81,000 may get filled if market dips.
Bias: Short-term bullish continuation possible, but supply zones overhead are heavy.
📊 Trade Plan (Next Session)
Bullish Scenario (if demand holds 80,700–80,900)
Entry: 80,900–81,000 (on retest/fill of imbalance).
Targets:
TP1 → 81,300 (minor resistance).
TP2 → 81,600–81,800 (channel supply + OB).
Stop: Below 80,650.
Bearish Scenario (if rejection continues at 81,300–81,600)
Entry: 81,200–81,400 zone (look for rejection candle).
Targets:
TP1 → 80,900.
TP2 → 80,600–80,500 (major demand).
Stop: Above 81,650.
🎯 Summary
Intraday bias: Mildly bullish until 81,600–81,800 is tested.
Swing bias: Still bearish inside descending channel unless a clear breakout >81,800–82,000 occurs.
Best trade idea: Buy dips around 80,900–81,000 with TP towards 81,600, then watch for reversal signs.
4H Chart
Price is still respecting the descending channel.
Recent rejection came right from the channel supply + OB zone ~81,600–81,800.
Support demand holds near 80,600–80,750, which has been tested multiple times.
Market is consolidating between 80,600–81,600.
Bias: Range-bound inside larger downtrend. Unless 81,800 breaks, structure remains corrective.
1H Chart
Clear swing high rejection at 81,600.
Price retraced to FVG + demand block around 80,700–80,800, and bounced.
Currently trading near 81,100–81,200 (mid-channel zone).
Liquidity pools visible above 81,600 (short-trap potential).
Bias: Intraday bullish bias from demand zones, but still capped by channel supply.
15M Chart
Short-term MSB → BOS → Retest seen near 80,700.
Price is consolidating just below minor resistance 81,200–81,300.
Imbalances (FVG) left around 80,900–81,000 may get filled if market dips.
Bias: Short-term bullish continuation possible, but supply zones overhead are heavy.
📊 Trade Plan (Next Session)
Bullish Scenario (if demand holds 80,700–80,900)
Entry: 80,900–81,000 (on retest/fill of imbalance).
Targets:
TP1 → 81,300 (minor resistance).
TP2 → 81,600–81,800 (channel supply + OB).
Stop: Below 80,650.
Bearish Scenario (if rejection continues at 81,300–81,600)
Entry: 81,200–81,400 zone (look for rejection candle).
Targets:
TP1 → 80,900.
TP2 → 80,600–80,500 (major demand).
Stop: Above 81,650.
🎯 Summary
Intraday bias: Mildly bullish until 81,600–81,800 is tested.
Swing bias: Still bearish inside descending channel unless a clear breakout >81,800–82,000 occurs.
Best trade idea: Buy dips around 80,900–81,000 with TP towards 81,600, then watch for reversal signs.
Disclaimer
The information and publications are not meant to be, and do not constitute, financial, investment, trading, or other types of advice or recommendations supplied or endorsed by TradingView. Read more in the Terms of Use.
Disclaimer
The information and publications are not meant to be, and do not constitute, financial, investment, trading, or other types of advice or recommendations supplied or endorsed by TradingView. Read more in the Terms of Use.