Hi guys!
Bullish Divergence
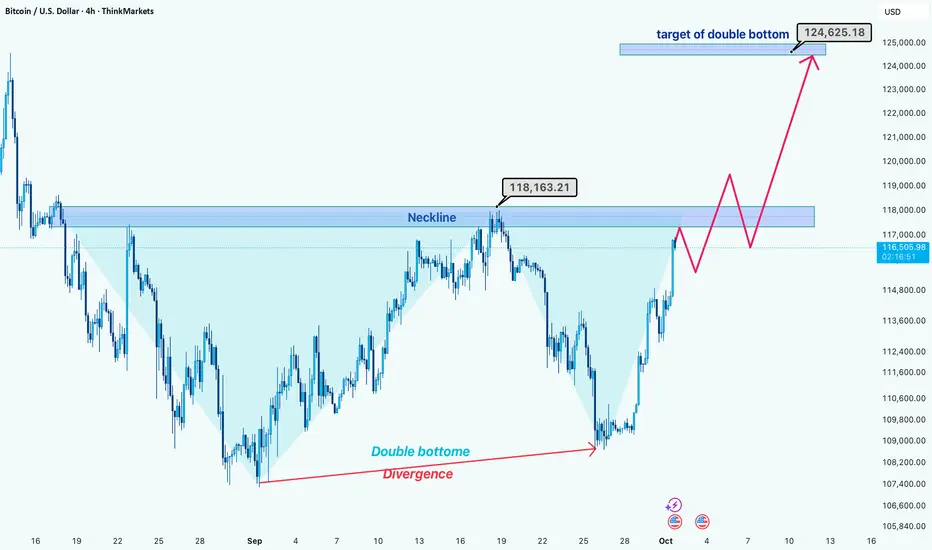
Bitcoin has recently formed a bullish divergence, which signals that selling pressure is weakening and buyers are stepping in.
Double Bottom Formation
A double bottom pattern is clearly visible, but the critical neckline resistance around $118,163 hasn’t been broken yet. This area is the key confirmation level.
Potential Breakout
Thanks to the bullish divergence, there’s a strong possibility that BTC will break above this neckline in the coming sessions.
Long Position Strategy
The safest long entry would be after the neckline breakout and a small pullback (correction) to confirm support. This reduces the risk of a false breakout.
Target Projection
If confirmed, the double bottom pattern projects a target around $124,600, offering a solid upside potential from the current levels.
Disclaimer: As part of ThinkMarkets’ Influencer Program, I am sponsored to share and publish their charts in my analysis.
Bullish Divergence
Bitcoin has recently formed a bullish divergence, which signals that selling pressure is weakening and buyers are stepping in.
Double Bottom Formation
A double bottom pattern is clearly visible, but the critical neckline resistance around $118,163 hasn’t been broken yet. This area is the key confirmation level.
Potential Breakout
Thanks to the bullish divergence, there’s a strong possibility that BTC will break above this neckline in the coming sessions.
Long Position Strategy
The safest long entry would be after the neckline breakout and a small pullback (correction) to confirm support. This reduces the risk of a false breakout.
Target Projection
If confirmed, the double bottom pattern projects a target around $124,600, offering a solid upside potential from the current levels.
Disclaimer: As part of ThinkMarkets’ Influencer Program, I am sponsored to share and publish their charts in my analysis.
Trade active
Note
it is runningTrade closed: target reached
You can close 70% of it hereNote
final target has been touched:Proud ThinkMarkets Ambassador -> Discover & Grow: bit.ly/Think-Markets
------
My recommended Exchange -> YEX: bit.ly/YEX-M
------
Telegram channel: t.me/melikatrader94
Forex channel: t.me/melikatrader94GoldForex
------
My recommended Exchange -> YEX: bit.ly/YEX-M
------
Telegram channel: t.me/melikatrader94
Forex channel: t.me/melikatrader94GoldForex
Related publications
Disclaimer
The information and publications are not meant to be, and do not constitute, financial, investment, trading, or other types of advice or recommendations supplied or endorsed by TradingView. Read more in the Terms of Use.
Proud ThinkMarkets Ambassador -> Discover & Grow: bit.ly/Think-Markets
------
My recommended Exchange -> YEX: bit.ly/YEX-M
------
Telegram channel: t.me/melikatrader94
Forex channel: t.me/melikatrader94GoldForex
------
My recommended Exchange -> YEX: bit.ly/YEX-M
------
Telegram channel: t.me/melikatrader94
Forex channel: t.me/melikatrader94GoldForex
Related publications
Disclaimer
The information and publications are not meant to be, and do not constitute, financial, investment, trading, or other types of advice or recommendations supplied or endorsed by TradingView. Read more in the Terms of Use.