1. Price Action & Structure
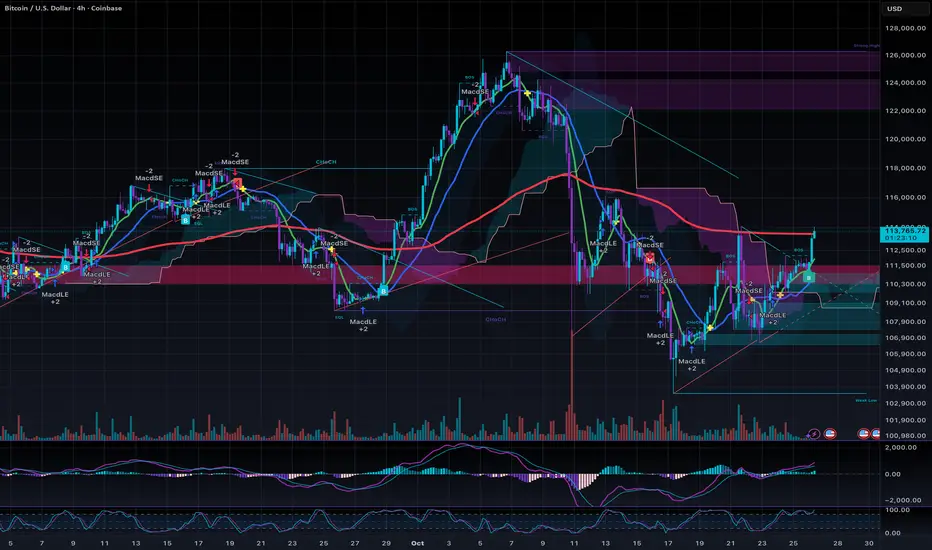
• Trend: The corrective pullback within the ascending channel continues, with current price at 113,700 USD, up slightly from the recent low near 111,758 USD. This follows the lower high at 114,000 USD (versus prior 116,000 USD peak), indicating ongoing consolidation rather than acceleration lower.
• Support Levels: Immediate support strengthened at 111,500–112,000 USD (61.8% Fibonacci and channel lower boundary). Secondary support at 109,000 USD (50% retracement and prior low).
• Resistance Levels: Near-term resistance at 114,000 USD (recent lower high). A close above 114,500 USD targets the prior 116,000 USD level.
• Candlestick Patterns: The move to 113,700 USD shows a small bullish candle with reduced red volume, suggesting potential stabilization. No clear reversal pattern yet, but diminishing downside volume implies fading seller control.
2. Trend Indicators
• Channel Analysis: Price remains above the ascending channel’s lower trendline (from 101,400 USD low to 116,000 USD high), now near 112,000 USD. This level’s hold supports the broader uptrend; violation would target 108,500 USD.
• Fibonacci Retracement: From 101,400 USD low to 116,000 USD previous high:
◦ 23.6% at 115,100 USD (above current price).
◦ 38.2% at 113,000 USD (recently reclaimed, acting as support).
◦ 50% at 108,700 USD (deeper correction).
◦ 61.8% at 111,000 USD (prior test, now buffer).
• Moving Averages: 50-period EMA at 112,900 USD is providing confluence support and beginning to flatten, hinting at possible trend resumption if crossed upward.
3. Momentum Indicators
• MACD: The bearish crossover persists, but histogram contraction (less negative bars) indicates waning downside momentum. A bullish flip above the signal line near zero would confirm reversal.
• RSI: Rising to 45–48 from oversold levels, showing mild recovery without overextension. Bullish divergence emerging if price holds while RSI stabilizes above 45.
• Other Oscillators: Stochastic exiting oversold (crossing above 20), supporting a potential short-term bounce.
4. Volatility Indicators
• Bollinger Bands: Price is rebounding from near the lower band (112,000 USD) toward the middle band (113,200 USD), with bands stabilizing after expansion. This setup favors mean reversion to 114,000 USD if volatility contracts further.
• Volume Profile: Volume on the recent low was lower than prior declines, indicating reduced distribution. Potential accumulation building at 113,000 USD.
5. Market Sentiment
• Bullish Scenario (45% Probability): The uptick to 113,700 USD and momentum stabilization could lead to a retest of 114,000 USD, preserving the channel uptrend toward 116,000 USD.
• Bearish Scenario (55% Probability): Renewed selling below 112,000 USD targets 109,000 USD, though less likely given volume fade.
• Overall Bias: Shifting to neutral-bullish, with the price recovery reducing immediate downside risk.
Trading Strategy Update
• Long Entry: Enter on confirmation above 114,000 USD, with stop-loss below 113,700 USD. Target 116,500 USD (1:2 risk-reward ratio).
• Short Entry: Initiate only on breakdown below 113,700 USD, with stop above 114,000 USD. Target 111,000 USD.
CEO and founder / AI engineer, realtor, Investor & trader. ~Attention is a tradable asset. | 🥷@syndicateninja 🫧 @hype_protocol 🎟️ @fairlootcom 🏦 @Manerabank
Disclaimer
The information and publications are not meant to be, and do not constitute, financial, investment, trading, or other types of advice or recommendations supplied or endorsed by TradingView. Read more in the Terms of Use.