1. Market Structure & Liquidity Sweep Zones
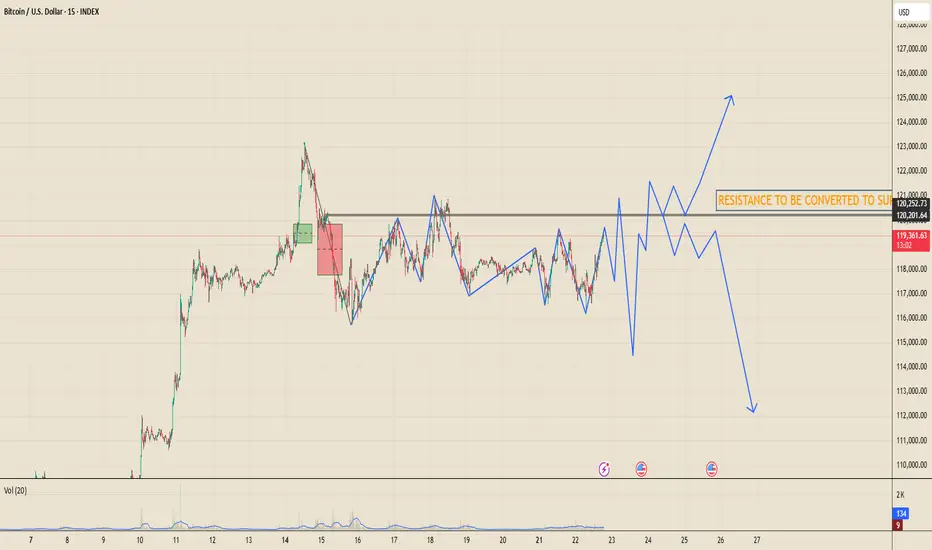
Observation: The recent bullish leg from the swing low broke structure to the upside but has not yet convincingly closed above the key resistance zone (120200–120250).
Interpretation: This is a potential buy-side liquidity sweep zone. The market may wick above this zone to trap breakout buyers (fakeout) or convert it into support (true BOS – Break of Structure).
2. Order Blocks & Imbalance (FVG Zones)
Observation: There is a visible bearish order block near your marked resistance zone (likely from the red candle prior to major drop), and small fair value gaps (FVG) just below the resistance zone on LTF.
Interpretation: If price fills the imbalance and reacts to the OB (Order Block), a rejection is likely. Conversely, a clean break + close above and retest = bullish confirmation.
3. Smart Money Concepts (Reaccumulation or Distribution)
Scenario 1 (Bullish): If we see a W-pattern or reaccumulation above the 120250 zone (with BOS + CHoCH confirmation), then the market will likely aim for higher liquidity targets near 124000–125000.
Scenario 2 (Bearish): If the zone acts as distribution, expect an M-pattern or liquidity grab followed by a sharp reversal toward 117000 → 115000.
4. Internal Range Liquidity
Observation: The current consolidation between 118000–120200 is an internal liquidity trap.
Interpretation: The price is hunting both sides of liquidity. Only a decisive breakout will confirm directional intent.
5. Volume/Price Imbalance & Timing
Volume in this range (esp. around your resistance) likely shows low conviction → indicating indecision.
BTC is known to make explosive moves post such compressions. Hence, timing the breakout with volume surge can provide high R:R entries.
Disclaimer
The information and publications are not meant to be, and do not constitute, financial, investment, trading, or other types of advice or recommendations supplied or endorsed by TradingView. Read more in the Terms of Use.
Disclaimer
The information and publications are not meant to be, and do not constitute, financial, investment, trading, or other types of advice or recommendations supplied or endorsed by TradingView. Read more in the Terms of Use.