Hello everyone !
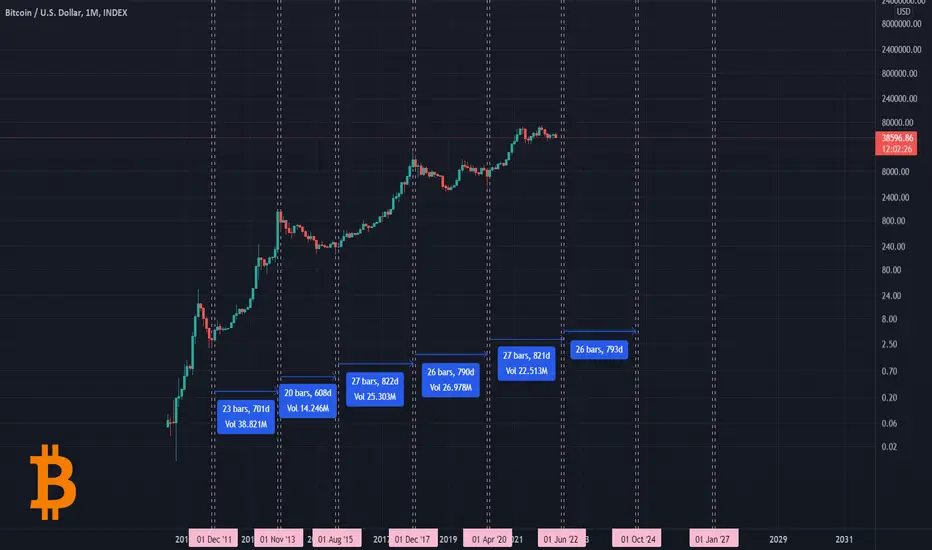
With this chart you can always know when the exact time for BTC and the whole crypto market to turn Bullish or Bearish in this repetitive cycle.
Each part consists of two lines, the first line to indicate the end of the current cycle and the second line to indicate the beginning of the new cycle.
The average is 748 Days for all cycles, And as you can see in terms of time market is too close to turn, So be aware of Bears!
----------------------------------------------------------------
Liked the idea?
Comment, Like, Follow ✌
Disclaimer
The information and publications are not meant to be, and do not constitute, financial, investment, trading, or other types of advice or recommendations supplied or endorsed by TradingView. Read more in the Terms of Use.
Disclaimer
The information and publications are not meant to be, and do not constitute, financial, investment, trading, or other types of advice or recommendations supplied or endorsed by TradingView. Read more in the Terms of Use.