Bitcoin – H4 Mid-Term Analysis
Hello Traders,
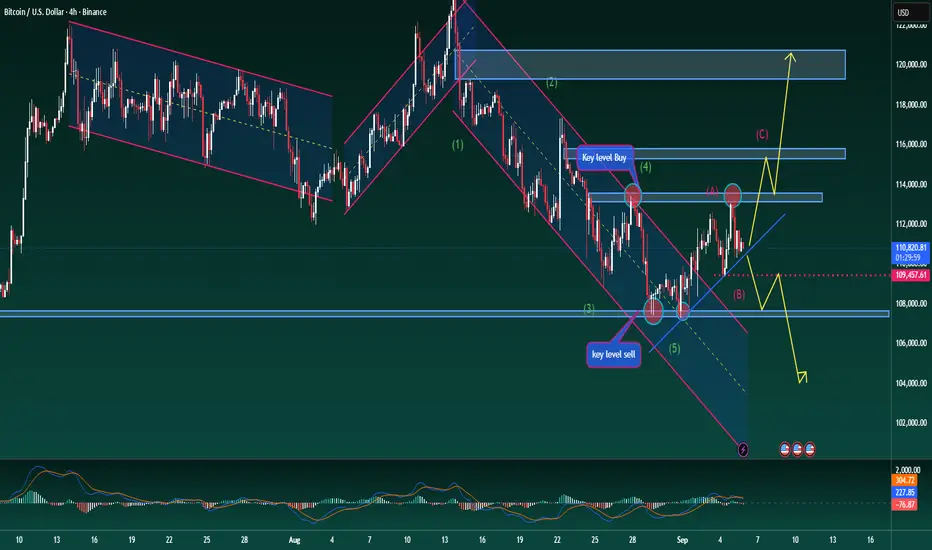
Bitcoin continues to trade within a wide sideways range. Despite the spike in volume following the recent NFP release, the market has not yet confirmed a dominant trend. Price action is still rotating within the 107k – 113k zone.
Elliott Wave Perspective
Wave 5 appears to have completed, and an A–B corrective structure is taking shape. This opens the possibility for one more upward leg before the next decisive move develops.
Trendline & Key Levels
A descending trendline is currently acting as resistance. It may offer early short opportunities, though a clear break below 107k is required to confirm a mid-term bearish outlook.
On the flip side, if price respects the trendline and bounces higher, a wave C rally could unfold.
Importantly, BTC is still holding above the rising channel, suggesting that bearish momentum remains limited for now.
Scenarios to Watch
Bullish Case:
If Bitcoin sustains above 107k and manages a breakout above 113k, momentum could extend towards 115k – 118k. Long positions can be considered once confirmation comes from stronger volume or a MACD crossover.
Bearish Case:
Failure to hold above 107k would expose the market to further downside, targeting 104k – 101k where strong historical support is located.
Professional Take
The market remains indecisive in the mid-term, with no clear directional bias yet. Traders should closely watch the reaction at 107k and the descending trendline to determine the next move. Flexibility and strict risk management are essential in this phase of heightened volatility.
Hello Traders,
Bitcoin continues to trade within a wide sideways range. Despite the spike in volume following the recent NFP release, the market has not yet confirmed a dominant trend. Price action is still rotating within the 107k – 113k zone.
Elliott Wave Perspective
Wave 5 appears to have completed, and an A–B corrective structure is taking shape. This opens the possibility for one more upward leg before the next decisive move develops.
Trendline & Key Levels
A descending trendline is currently acting as resistance. It may offer early short opportunities, though a clear break below 107k is required to confirm a mid-term bearish outlook.
On the flip side, if price respects the trendline and bounces higher, a wave C rally could unfold.
Importantly, BTC is still holding above the rising channel, suggesting that bearish momentum remains limited for now.
Scenarios to Watch
Bullish Case:
If Bitcoin sustains above 107k and manages a breakout above 113k, momentum could extend towards 115k – 118k. Long positions can be considered once confirmation comes from stronger volume or a MACD crossover.
Bearish Case:
Failure to hold above 107k would expose the market to further downside, targeting 104k – 101k where strong historical support is located.
Professional Take
The market remains indecisive in the mid-term, with no clear directional bias yet. Traders should closely watch the reaction at 107k and the descending trendline to determine the next move. Flexibility and strict risk management are essential in this phase of heightened volatility.
🔥 BrianLionCapital – Where Top Traders Unite
✅ Accurate signals & exclusive analysis: 10–15 signals daily with continuous market insights
⏳ Every minute you hesitate is a winning opportunity slipping away!
t.me/+jmo_lLLuUuYwZTI1
✅ Accurate signals & exclusive analysis: 10–15 signals daily with continuous market insights
⏳ Every minute you hesitate is a winning opportunity slipping away!
t.me/+jmo_lLLuUuYwZTI1
Disclaimer
The information and publications are not meant to be, and do not constitute, financial, investment, trading, or other types of advice or recommendations supplied or endorsed by TradingView. Read more in the Terms of Use.