When comparing the previous analysis with the latest chart, we can clearly see how mathematical and statistical models helped anticipate Bitcoin’s movements with remarkable accuracy using Fibonacci retracements.
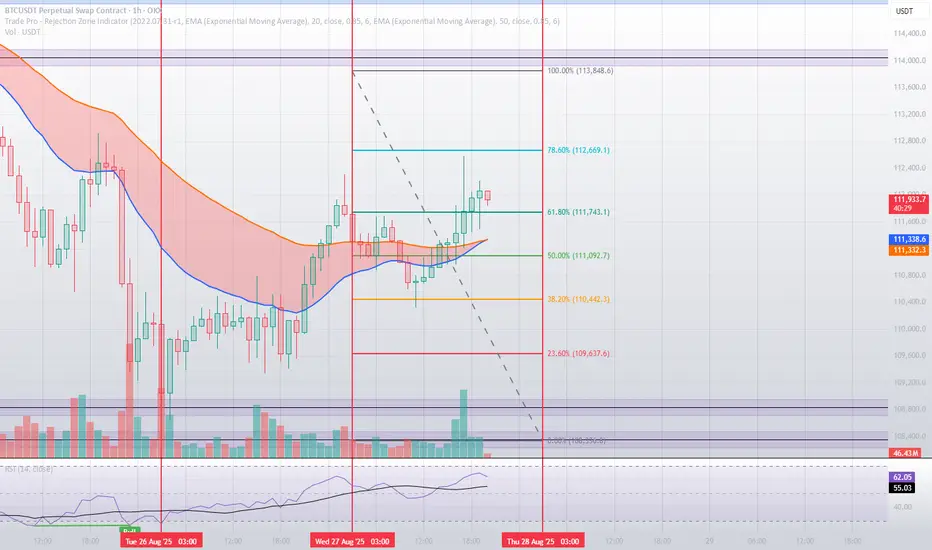
🔹 In the earlier analysis, we highlighted the 61.8% level at $111,743 as a decisive pivot. The new chart shows that the price indeed rallied into this zone, even pushing slightly higher towards the 78.6% level at $112,669 before facing strong selling pressure. This demonstrates the precision of mathematical models in mapping potential turning points before they happen. 📈
🔹 Support levels projected previously — such as $110,442 and $109,637 — remain intact as strong defensive zones, perfectly aligned with historical rebound areas.
⚖️ The Comparison
Mathematics and statistics are not just theoretical tools; they provide a real-time roadmap for traders:
Upside: Price climbed to the 78.6% Fibonacci extension as projected. 🚀
Downside: Key supports held firm, validating the statistical forecasts. 🛡️
🔍 Momentum indicators (RSI) also confirmed this move: rising from the neutral 52–54 range in the earlier chart to above 62 in the latest one, reinforcing the bullish swing towards mathematically calculated targets.
✅ Conclusion
From one chart to the next, it becomes clear: mathematical and statistical models are not only explanatory but predictive. Fibonacci levels acted as precise guideposts, allowing us to foresee both potential highs and lows. Their reflection on actual market action proves the strength of these models — a must-have tool for any professional trader seeking accuracy and confidence. 💡📊
Disclaimer
The information and publications are not meant to be, and do not constitute, financial, investment, trading, or other types of advice or recommendations supplied or endorsed by TradingView. Read more in the Terms of Use.
Disclaimer
The information and publications are not meant to be, and do not constitute, financial, investment, trading, or other types of advice or recommendations supplied or endorsed by TradingView. Read more in the Terms of Use.