📊  BTCUSD continued to decrease again in the past 2 days. Let's evaluate and look for opportunities through the multi-timeframe perspective below
  BTCUSDT :
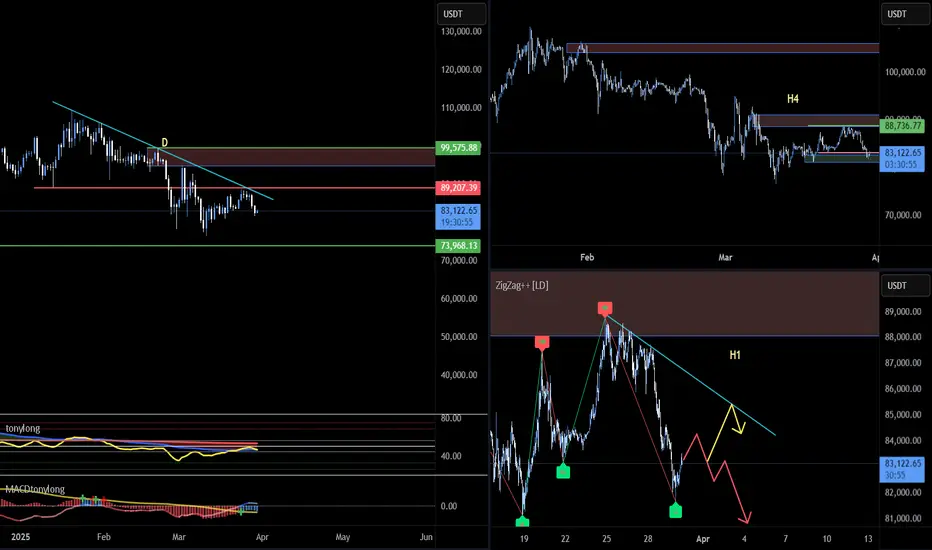
🔹 **D Frame**: Before the price decrease in the past 2 days, we can see that although BTC had a recovery phase before, the fake decrease structure has not been broken yet.
🔹 **H4 Frame**: The keylever zone has been broken as marked on the chart, however, this is the first decrease after the increase wave in the past days, so it will need clearer confirmation.
🔹 **H1 Frame**: Currently, the price is reacting to the support zone of 81~83k. However, the price is still in a downward wave if looking at the price structure.
🚀 **Trading plan:*
📌 At the present time, we can look for a SELL position in line with the main trend in diagonal resistance areas to look for a trading position in line with the main trend. The current price is at an important support area, so it is no longer suitable to SELL at this time. BUYing in this area is not recommended when the downtrend has not shown any signs of ending. We will have to wait for a clearer signal from the price structure to properly assess the effect of the current support area.
💪 **Wishing you success in making a profit!**
Related publications
Disclaimer
The information and publications are not meant to be, and do not constitute, financial, investment, trading, or other types of advice or recommendations supplied or endorsed by TradingView. Read more in the Terms of Use.
Related publications
Disclaimer
The information and publications are not meant to be, and do not constitute, financial, investment, trading, or other types of advice or recommendations supplied or endorsed by TradingView. Read more in the Terms of Use.