📝 Description:
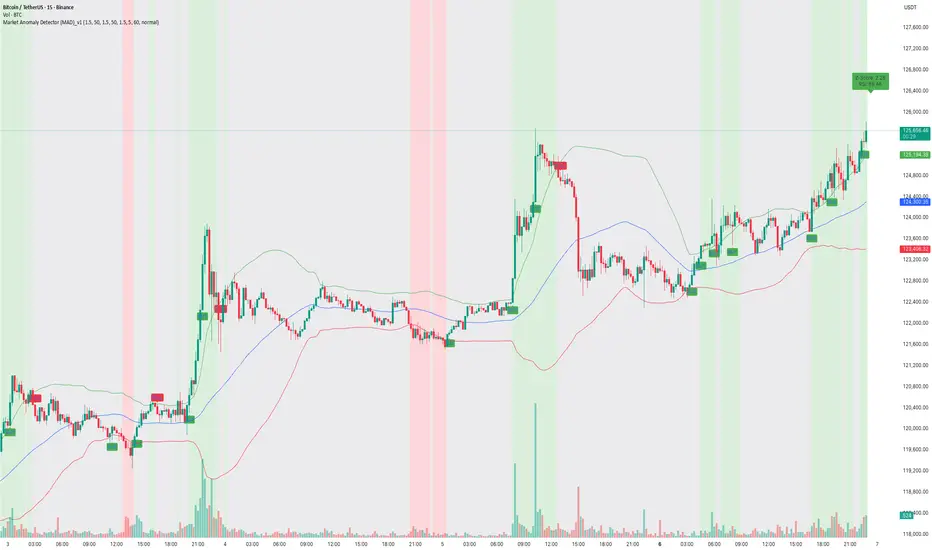
Watch how the Market Anomaly Detector (MAD) precisely captured the start of the Bitcoin breakout on the 15-minute chart — with no lag, early confirmation, and clear signals.
This BTC/USDT rally was flagged using:
• ✅ Z-Score Spike + RSI confirmation
• ✅ Volume Thrust + Trend Strength Filter
• ✅ Dynamic Zone Coloring for Visual Clarity
• ✅ Trade Cooldown Filter to avoid signal noise
💡 The green background highlights anomaly confirmation zones, while red indicates potential fakeouts or traps.
In this rally:
• The MAD indicator identified the compression breakout
• Maintained bullish zone with no false exit
• Generated a clean trend-following environment using adaptive logic.
🔍 Why MAD Works:
The MAD Indicator isn’t just about spotting anomalies — it adapts based on:
• Market volatility and relative volume
• Internal momentum using z-score logic
• Confirmation from RSI & EMAs
• A cooldown filter to prevent overtrading in choppy zones
📈 Perfect for scalpers, intraday traders, and short-term swing setups on crypto and stocks.
Thanks.
TradeTech Analysis
Telegram Channel - t.me/Tradetech2024
Youtube Channel - youtube.com/@TradeTechAnalysis
Website - tradetechanalysis.com/
Super Profile - superprofile.bio/tradetechanalysis
TradeTech Analysis
Telegram Channel - t.me/Tradetech2024
Youtube Channel - youtube.com/@TradeTechAnalysis
Website - tradetechanalysis.com/
Super Profile - superprofile.bio/tradetechanalysis
Disclaimer
The information and publications are not meant to be, and do not constitute, financial, investment, trading, or other types of advice or recommendations supplied or endorsed by TradingView. Read more in the Terms of Use.