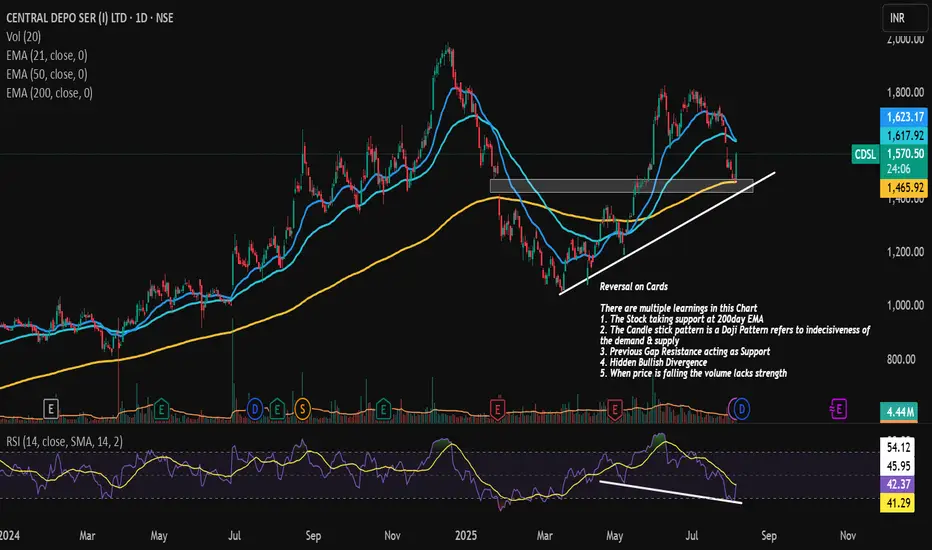
CDSL is on the verge or Reversal or Temporary Pull back
There are multiple learnings in this Chart
1. The Stock taking support at 200day EMA
2. The Candle stick pattern is a Doji Pattern refers to indecisiveness of the demand & supply
3. Previous Gap Resistance acting as Support
4. Hidden Bullish Divergence
5. When price is falling the volume lacks strength
Related publications
Disclaimer
The information and publications are not meant to be, and do not constitute, financial, investment, trading, or other types of advice or recommendations supplied or endorsed by TradingView. Read more in the Terms of Use.
Related publications
Disclaimer
The information and publications are not meant to be, and do not constitute, financial, investment, trading, or other types of advice or recommendations supplied or endorsed by TradingView. Read more in the Terms of Use.