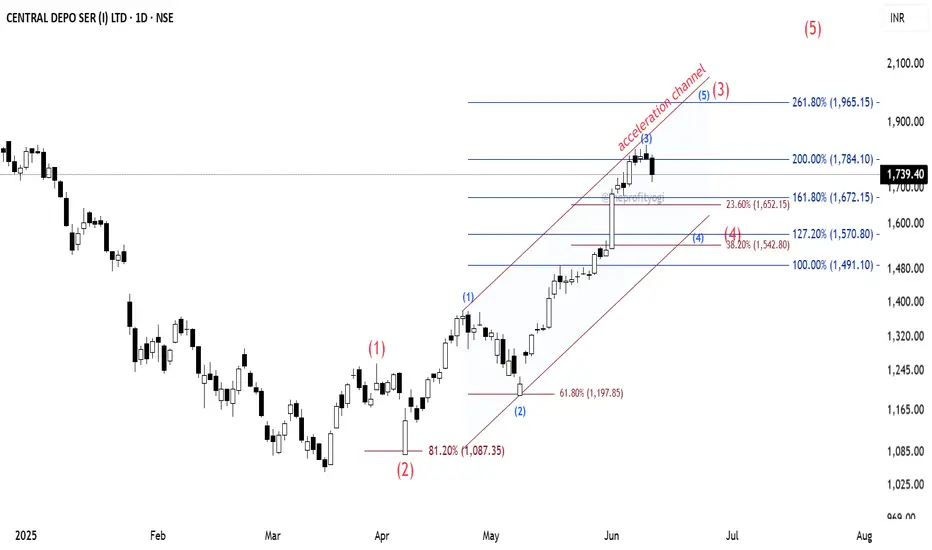
The CDSL daily chart indicates that the stock is in an impulse.
See the counting using Elliott Wave theory where the major wave (2) (shown in red) bounced from the 81.2% level to enter into wave (3).
The subordinate of wave (3) are shown in blue colour, where we can see the subordinate wave (2) of major wave (3) bounced from 61.8%.
To get the possible projection of the subordinate wave (3), I have applied Fibonacci extension to it, and we can see the price is at 200% extension currently. If the recent high is not broken up, we can presume that this is the top of wave (3).
Now, wave (4) will form. And for predicting wave (4) target that I have plotted the Acceleration Channel. This channel can be plotted by joining the line from the top of wave (1) to the top of wave (3) and then its parallel line from the bottom of wave (2).
This channel gives us a hint about where wave (4) may terminate.
Also, I have applied Fibonacci retracement from the bottom of wave (1) to the top of wave (3), and as we know that wave (4) may terminate between 23.6% and 38.2% levels.
So we can get some idea about where wave (4) may complete.
We can see there are clusters of Fib extension and retracement levels near these zones. So we may have a safe buying zone between those.
Important: Here, I have assumed that the subordinate wave (3) is completed.
If the price crosses above the recent top, then we have to replot and recount this study.
This analysis is based on Elliott Wave theory and Fibonacci.
This analysis is for educational purposes only.
This is not any buying recommendations.
Disclaimer
The information and publications are not meant to be, and do not constitute, financial, investment, trading, or other types of advice or recommendations supplied or endorsed by TradingView. Read more in the Terms of Use.
Disclaimer
The information and publications are not meant to be, and do not constitute, financial, investment, trading, or other types of advice or recommendations supplied or endorsed by TradingView. Read more in the Terms of Use.