Trading Idea: CRUS (Cirrus Logic, Inc.) - Long Setup Targeting Breakout
Symbol: NASDAQ:CRUS
Recommendation: BUY
Strategy: Swing to Position Trade (Fundamentally Supported Breakout)
🎯 Trade Summary
Entry: $122.33 (Limit order on a pullback to support preferred)
Stop Loss: $109.80
Take Profit 1: $138.00 (Partial Profit)
Take Profit 2: $146.30
Risk/Reward Ratio: 1:2.1
📊 Technical Analysis
1. Trend & Structure:
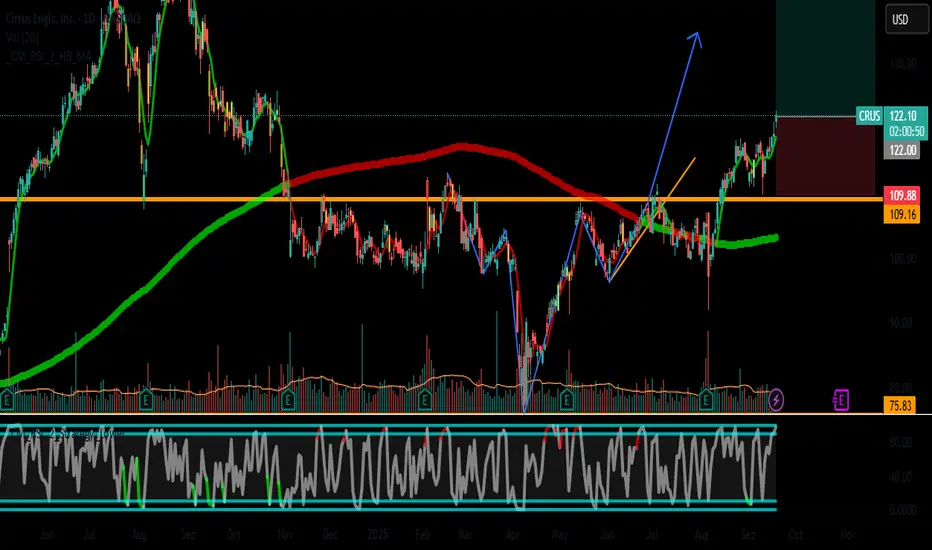
The chart shows a clear higher high and higher low structure, confirming the primary uptrend is intact.
The recent consolidation near the $120 level is interpreted as a healthy bull flag/pause, not a reversal.
2. Key Levels:
Support (Buy Zone): $120 - $122. This level has acted as both previous resistance and now support. It also coincides with the rising 20-period SMA, adding confluence.
Resistance (Profit Target): The measured move from the recent consolidation pattern projects a target towards the $146 area.
3. Indicators & Confluence:
RSI: Is hovering around 60-65, indicating healthy bullish momentum without being overbought. There is ample room for the trend to continue.
Volume: Look for an increase in volume on the breakout above $125 to confirm buyer commitment.
The entry point offers a favorable location relative to the risk, placing the stop below a significant support cluster.
⚖️ Fundamental Catalyst
This trade is not just technical; it is supported by strong underlying fundamentals:
Revenue & Earnings Growth: CRUS has demonstrated strong growth in net income YoY.
Healthy Balance Sheet: The company boasts an exceptionally strong financial position with virtually no debt and a perfect debt health score.
Valuation: While not deeply undervalued, current ratios are considered fairly valued for a growth company in its sector.
This fundamental strength provides a solid foundation for the technical breakout to play out and reduces the probability of a catastrophic breakdown.
⚠️ Risk Management
The stop loss at $109.80 is placed below the significant support level and the 50-period SMA. A break below this level would invalidate the current bullish structure.
Position size accordingly so that a hit to the stop loss does not exceed 1-2% of your total capital.
Consider taking off 50% of the position at the first target (~$138) and moving your stop loss to breakeven on the remainder to secure profits and let the runner ride to $146.30.
‼️ DISCLAIMER
This post is for educational and informational purposes only and should not be construed as financial advice or a recommendation to buy or sell any security. Trading stocks, options, futures, and cryptocurrencies involves substantial risk of loss and is not suitable for every investor. The charts, analysis, and trade ideas shared are my personal opinions and should not be the sole basis for any investment decision.
You should always conduct your own due diligence and consult with a qualified financial advisor before making any investment decisions. Past performance is not indicative of future results.
Happy Trading!
#SwingTrading #Long #NASDAQ #CRUS #TradingSetup #Breakout #Investing #TechnicalAnalysis #FundamentalAnalysis
Symbol: NASDAQ:CRUS
Recommendation: BUY
Strategy: Swing to Position Trade (Fundamentally Supported Breakout)
🎯 Trade Summary
Entry: $122.33 (Limit order on a pullback to support preferred)
Stop Loss: $109.80
Take Profit 1: $138.00 (Partial Profit)
Take Profit 2: $146.30
Risk/Reward Ratio: 1:2.1
📊 Technical Analysis
1. Trend & Structure:
The chart shows a clear higher high and higher low structure, confirming the primary uptrend is intact.
The recent consolidation near the $120 level is interpreted as a healthy bull flag/pause, not a reversal.
2. Key Levels:
Support (Buy Zone): $120 - $122. This level has acted as both previous resistance and now support. It also coincides with the rising 20-period SMA, adding confluence.
Resistance (Profit Target): The measured move from the recent consolidation pattern projects a target towards the $146 area.
3. Indicators & Confluence:
RSI: Is hovering around 60-65, indicating healthy bullish momentum without being overbought. There is ample room for the trend to continue.
Volume: Look for an increase in volume on the breakout above $125 to confirm buyer commitment.
The entry point offers a favorable location relative to the risk, placing the stop below a significant support cluster.
⚖️ Fundamental Catalyst
This trade is not just technical; it is supported by strong underlying fundamentals:
Revenue & Earnings Growth: CRUS has demonstrated strong growth in net income YoY.
Healthy Balance Sheet: The company boasts an exceptionally strong financial position with virtually no debt and a perfect debt health score.
Valuation: While not deeply undervalued, current ratios are considered fairly valued for a growth company in its sector.
This fundamental strength provides a solid foundation for the technical breakout to play out and reduces the probability of a catastrophic breakdown.
⚠️ Risk Management
The stop loss at $109.80 is placed below the significant support level and the 50-period SMA. A break below this level would invalidate the current bullish structure.
Position size accordingly so that a hit to the stop loss does not exceed 1-2% of your total capital.
Consider taking off 50% of the position at the first target (~$138) and moving your stop loss to breakeven on the remainder to secure profits and let the runner ride to $146.30.
‼️ DISCLAIMER
This post is for educational and informational purposes only and should not be construed as financial advice or a recommendation to buy or sell any security. Trading stocks, options, futures, and cryptocurrencies involves substantial risk of loss and is not suitable for every investor. The charts, analysis, and trade ideas shared are my personal opinions and should not be the sole basis for any investment decision.
You should always conduct your own due diligence and consult with a qualified financial advisor before making any investment decisions. Past performance is not indicative of future results.
Happy Trading!
#SwingTrading #Long #NASDAQ #CRUS #TradingSetup #Breakout #Investing #TechnicalAnalysis #FundamentalAnalysis
Disclaimer
The information and publications are not meant to be, and do not constitute, financial, investment, trading, or other types of advice or recommendations supplied or endorsed by TradingView. Read more in the Terms of Use.
Disclaimer
The information and publications are not meant to be, and do not constitute, financial, investment, trading, or other types of advice or recommendations supplied or endorsed by TradingView. Read more in the Terms of Use.