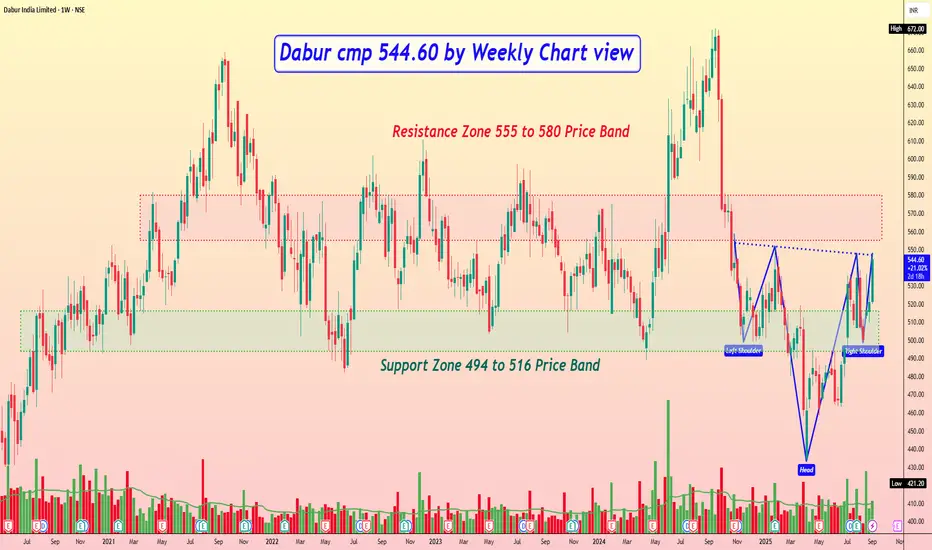
Dabur cmp 544.60 by Weekly Chart view
- Support Zone 494 to 516 Price Band
- Resistance Zone 494 to 516 Price Band
- Breakout probable basis ongoing Support Zone test retest
- Closely considerate Bullish Head & Shoulders with Resistance Zone neckline
- Volumes are seen spiking well above average traded quantity over the past few weeks
- Favorably trending Technical Indicator signals shown by BB, EMA, MACD, RSI, SuperTrend
Related publications
Disclaimer
The information and publications are not meant to be, and do not constitute, financial, investment, trading, or other types of advice or recommendations supplied or endorsed by TradingView. Read more in the Terms of Use.
Related publications
Disclaimer
The information and publications are not meant to be, and do not constitute, financial, investment, trading, or other types of advice or recommendations supplied or endorsed by TradingView. Read more in the Terms of Use.