Topic Statement:
Dixon has rebounded strongly in line with the broader market rally but now approaches critical resistance levels that may cap further upside.
Key Points:
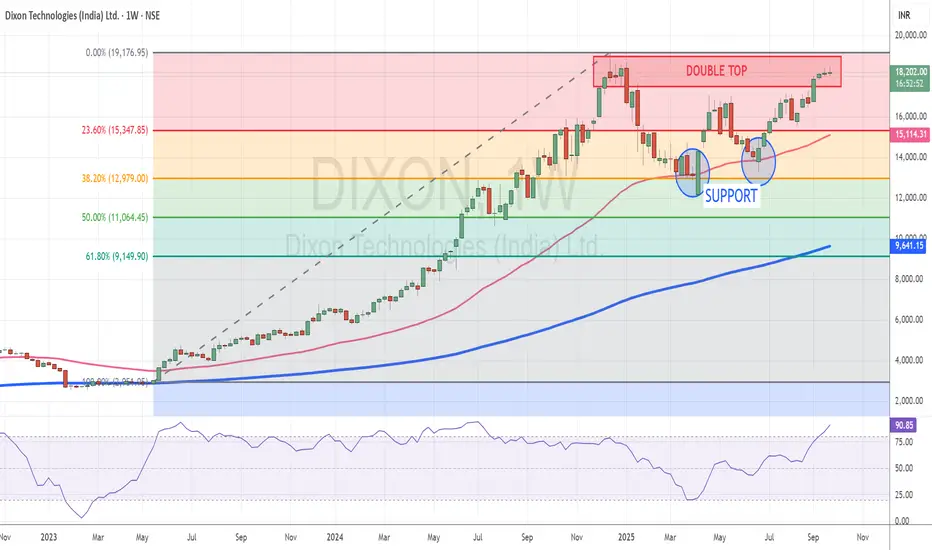
1. The stock retraced to the 38.2% Fibonacci level where it found strong support and resumed its upward move
2. The 50-day EMA acted as a deflection point, offering additional support during the recovery
3. Price is now at its lifetime high near the 18,000 mark, where a double top candlestick pattern is forming
4. The double top indicates significant resistance, making it a potential shorting opportunity unless a breakout confirms further bullishness
Dixon has rebounded strongly in line with the broader market rally but now approaches critical resistance levels that may cap further upside.
Key Points:
1. The stock retraced to the 38.2% Fibonacci level where it found strong support and resumed its upward move
2. The 50-day EMA acted as a deflection point, offering additional support during the recovery
3. Price is now at its lifetime high near the 18,000 mark, where a double top candlestick pattern is forming
4. The double top indicates significant resistance, making it a potential shorting opportunity unless a breakout confirms further bullishness
Disclaimer
The information and publications are not meant to be, and do not constitute, financial, investment, trading, or other types of advice or recommendations supplied or endorsed by TradingView. Read more in the Terms of Use.
Disclaimer
The information and publications are not meant to be, and do not constitute, financial, investment, trading, or other types of advice or recommendations supplied or endorsed by TradingView. Read more in the Terms of Use.