A pullback entry with volume contraction is a powerful setup used by swing traders and position traders to enter strong trends at low-risk points. Here's how you can identify and trade this setup:
✅ Concept:
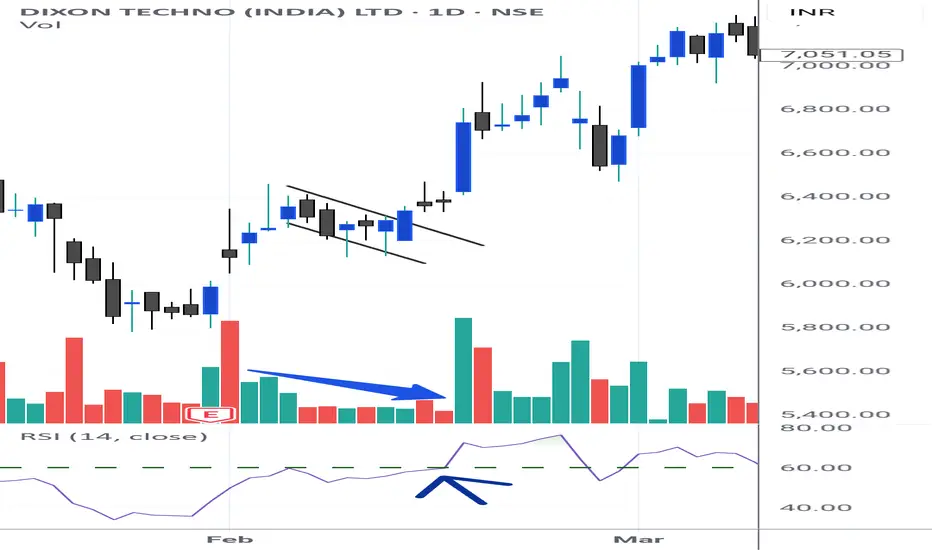
• A pullback is a temporary decline in price within an established uptrend.
• Volume contraction during this pullback shows reduced selling pressure, indicating that the correction is healthy and likely to resume upward.
📊 Technical Setup:
1. Trend Filter
• Uptrend confirmation using:
• Monthly RSI > 60
• Weekly RSI > 60
• 50 EMA above 200 EMA on Daily chart (optional confirmation)
2. Price Action
• Stock is making higher highs and higher lows
• After a sharp rally, price pulls back 3–5 candles on the Daily chart
• Pullback should be orderly (no panic selling or wide candles)
3. Volume Contraction
• Volume decreases gradually during the pullback
• Look for lowest volume near the end of the pullback
• Indicates sellers are drying up and big players are not exiting
4. Entry Trigger
• Entry when price breaks above previous day's high with:
• Spike in volume on breakout
• Optional: bullish candlestick (Marubozu, Bullish Engulfing, or Hammer)
5. Stop Loss
• Just below the pullback low or
• Below the 10 EMA on daily chart
6. Target
• First target = previous swing high
• Trail SL using ATR or 20 EMA if trend extends
📘 Example:
Let’s say you’re watching Tata Motors:
• Monthly RSI = 68
• Weekly RSI = 65
• Daily chart: Stock rallied from ₹800 to ₹860, then pulls back to ₹840 with 3 red candles
• Volume during pullback: 12M → 10M → 7M → 5M
• On Day 4, price forms a bullish hammer and breaks ₹845 on higher volume
📈 Entry = ₹845
🛑 Stop Loss = ₹835
🎯 Target = ₹865+ (prior high), trail after that
🔍 Bonus Filters (Optional):
• Inside bar formation
• Fibonacci retracement (38.2%–50% zone)
• Near support from moving averages (20 EMA / 50 EMA)
Check my previous post in understanding full concept in detail. Support and follow for PRO level understanding. Share with as many retail traders as possible.
God Bless you All!
Faraaz T
Sr. Equity Research Analyst
Stockholm Securities - UK
✅ Concept:
• A pullback is a temporary decline in price within an established uptrend.
• Volume contraction during this pullback shows reduced selling pressure, indicating that the correction is healthy and likely to resume upward.
📊 Technical Setup:
1. Trend Filter
• Uptrend confirmation using:
• Monthly RSI > 60
• Weekly RSI > 60
• 50 EMA above 200 EMA on Daily chart (optional confirmation)
2. Price Action
• Stock is making higher highs and higher lows
• After a sharp rally, price pulls back 3–5 candles on the Daily chart
• Pullback should be orderly (no panic selling or wide candles)
3. Volume Contraction
• Volume decreases gradually during the pullback
• Look for lowest volume near the end of the pullback
• Indicates sellers are drying up and big players are not exiting
4. Entry Trigger
• Entry when price breaks above previous day's high with:
• Spike in volume on breakout
• Optional: bullish candlestick (Marubozu, Bullish Engulfing, or Hammer)
5. Stop Loss
• Just below the pullback low or
• Below the 10 EMA on daily chart
6. Target
• First target = previous swing high
• Trail SL using ATR or 20 EMA if trend extends
📘 Example:
Let’s say you’re watching Tata Motors:
• Monthly RSI = 68
• Weekly RSI = 65
• Daily chart: Stock rallied from ₹800 to ₹860, then pulls back to ₹840 with 3 red candles
• Volume during pullback: 12M → 10M → 7M → 5M
• On Day 4, price forms a bullish hammer and breaks ₹845 on higher volume
📈 Entry = ₹845
🛑 Stop Loss = ₹835
🎯 Target = ₹865+ (prior high), trail after that
🔍 Bonus Filters (Optional):
• Inside bar formation
• Fibonacci retracement (38.2%–50% zone)
• Near support from moving averages (20 EMA / 50 EMA)
Check my previous post in understanding full concept in detail. Support and follow for PRO level understanding. Share with as many retail traders as possible.
God Bless you All!
Faraaz T
Sr. Equity Research Analyst
Stockholm Securities - UK
Disclaimer
The information and publications are not meant to be, and do not constitute, financial, investment, trading, or other types of advice or recommendations supplied or endorsed by TradingView. Read more in the Terms of Use.
Disclaimer
The information and publications are not meant to be, and do not constitute, financial, investment, trading, or other types of advice or recommendations supplied or endorsed by TradingView. Read more in the Terms of Use.