Timeframe: 30-Minute
Chart: Wall Street Index (US30)
Source: TradingView
________________________________________
🔍 Overview
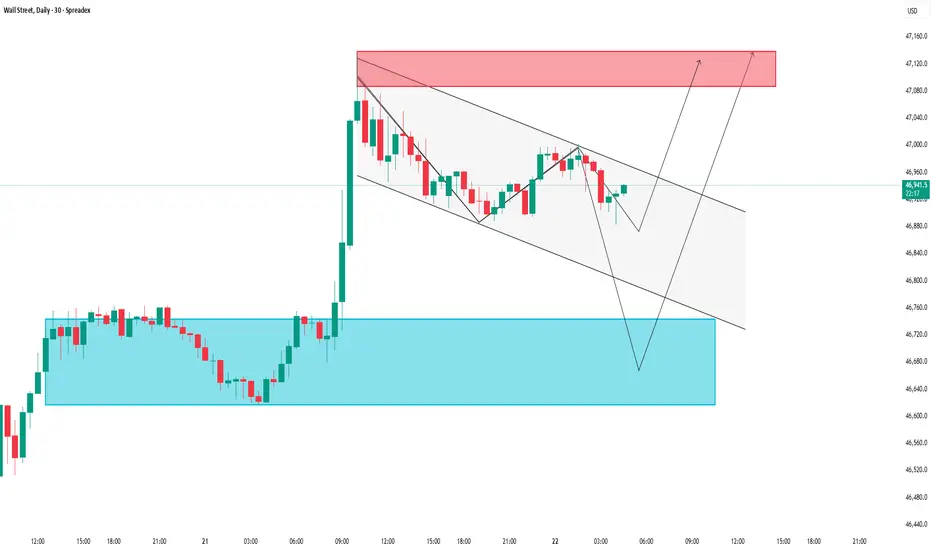
In this Wall Street index analysis, the US30 is currently consolidating within a descending price channel after a sharp bullish breakout from a key demand zone. The chart outlines potential price action scenarios based on key support and resistance levels derived from supply and demand dynamics.
________________________________________
Key Supply & Demand Zones
🔵 Demand Zone (Support Area): 46,660 – 46,720 USD
This is the deep support zone where price previously reversed sharply. It represents a high-probability buying area if retested.
🟢 Short-Term Support / Accumulation Zone: 46,880 – 46,950 USD
Price has shown multiple reactions here, indicating accumulation and temporary demand. A break below this area could lead to a move toward the lower demand zone.
🔴 Supply Zone (Resistance Area): 47,100 – 47,160 USD
This is a potential reversal zone where sellers may become active again. A breakout above this area could signal continuation of the bullish trend.
________________________________________
🧭 Technical Structure & Price Action Scenarios
The chart shows two main forecast scenarios for US30:
📉 Scenario 1: Bearish Pullback to the Lower Demand Zone
• Price gets rejected at the upper boundary of the descending channel.
• If bearish momentum continues, expect a decline toward the 46,660 – 46,720 USD zone.
• Look for bullish reversal signals such as a hammer or bullish engulfing candle before considering long positions.
📈 Scenario 2: Bullish Breakout Toward the Supply Zone
• If price sustains above 46,950 USD and breaks the descending trendline, a bullish move may be confirmed.
• Target zone: 47,100 – 47,160 USD.
• A successful breakout here could open up a continuation toward higher levels.
________________________________________
📌 Supporting Indicators
• Parabolic SAR: Dots are showing a potential shift during the retracement. Watch for dots flipping below price to support bullish continuation.
• Breakout Confirmation: The previous breakout above the 46,880 range adds weight to the current bullish outlook.
________________________________________
✅ Trading Setup Summary
Scenario Key Zone Action
📉 Pullback 46,660 – 46,720 Watch for long entry (support test)
📈 Breakout 46,950 Long toward 47,100 – 47,160
• Support Holding Above: 46,880 – 46,950 USD
• Resistance Zone to Watch: 47,100 – 47,160 USD
________________________________________
⚠️ Final Thoughts
The current structure indicates a pullback within a broader bullish context. Watch how price reacts at support zones and the descending channel. Traders should wait for clear confirmation before entering positions and maintain strict risk management.
📈 This setup is suitable for day traders and short-term swing traders looking to trade the US30 index based on clean price action and supply & demand logic.
Please like and comment below to support our traders. Your reactions will motivate us to do more analysis in the future 🙏✨
Harry Andrew @ ZuperView
👉 Explore all indicators & systems: zuperview.com/
👉 Join our Discord: discord.gg/YKE6ujrw59
All content provided by ZuperView is for informational & educational purposes only. Past performance does not guarantee future results.
👉 Join our Discord: discord.gg/YKE6ujrw59
All content provided by ZuperView is for informational & educational purposes only. Past performance does not guarantee future results.
Disclaimer
The information and publications are not meant to be, and do not constitute, financial, investment, trading, or other types of advice or recommendations supplied or endorsed by TradingView. Read more in the Terms of Use.