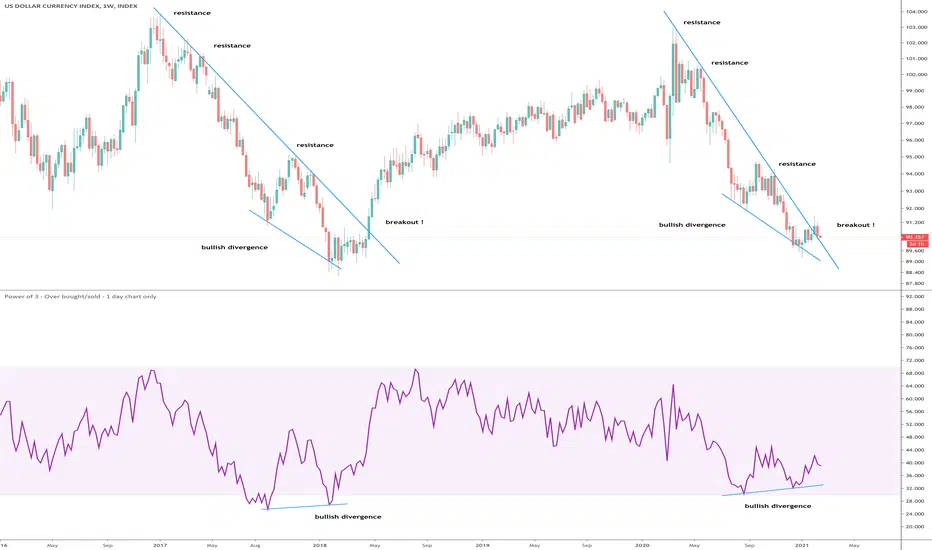
In the above weekly chart a fractal is visible.
1) Price action resistance trend line was tested on 3 occasions from January 2017 before a breakout in April 2018.
2) The same price action has occurred since March 2020 before a breakout in the last week.
3) Bullish divergence in price action with RSI.
What does this all mean?
If the Dollar is rising, the stock markets and crypto markets are likely to fall. However it is more than likely a final pump will be seen first. But, it will be short lived. Be careful.
On the 10-day chart of the S & P 500 below we can see price action printed a candle above a long term resistance trend line. I think we’re about to enter a ‘blow off top phase’ in the market cycle before the dollar rally begins and markets collapse.
Note
I get the chills when watching Brent's video with the top chart above.youtube.com/watch?v=PWVRWUkm54M
Note
Just watch again - If you don't have time to watch, one of the most powerful statements:"In the last 12 years the rest of the world borrowed 13 trillion in US dollars. The problem is the dollar did not get weaker during that time and now the rest of the world owes that debt in a currency they can’t print."
The FED are such @£$£@@£$.
Note
Strong demand for dollars yesterday - this should be fun. Why? When everyone tries to sell / exchange shares at the same time in an environment where dollar supply is limited will create an acute but time limited dollar demand.Note
2-day chart - double bullish engulfing candles. Look left - tightly packed bullish engulfing candles are not often seen but when they appear they signal dollar demand is about to make:
1) An imminent move
2) A strong upside move
Open any finance article right now, dollar printing to excess, dollar now worthless. The chart could not be further from this narrative.
Trade active
The energy into this breakout is impressive - dollar demand is exploding. If you're in an overbought stock (Telsa etc), then a rising dollar will crush those gains.Note
The 92 level was expected to offer significant resistance by many dollar bears. That has not happened, quite the opposite in fact.It is also interesting the 'short interest' in the dollar keeps on climbing. Bearish sentiment on the dollar is at record levels. We remember what happened with the Game Stop short squeeze don't we? ;)
Note
Another week, another increase in dollar strength. The pressure on overbought equities / crypto well be felt should this growth continue.Note
Bearish divergence emerging on the daily chart - the recent dollar pump might be on the verge of a correction.Note
Ignore that last update - don't know why I was looking at a daily, for some reason I thought it was the weekly.Talking of the weekly, price action moves to the upper half of the Bollinger Band - is a bigger move coming? This will be punishing for equities / Bitcoin if so.
Note
My goodness... despite all that printing the dollar is looking very bullish. What happened to 'inflation is coming!"?Circled in purple are two significant EMAs - look left. It is estimated they will cross by the end of the year. Fully expecting the dollar to breakout of the ascending triangle formation should that happen.
If that does indeed happen, don't be in stocks / crypto / property speculation / anything fueled with cheap credit will likely see significant corrections.
Trade active
** Dollar enters bull market - life cross printed **Since this idea was published the dollar index has increased a little over 7%. Let me tell you, it’s just getting started.
But it can’t! They’re printing so much. Inflation is here to stay! The chart says different. In a rising dollar environment speculative assets are going to crash hard. This is already evident in the US housing market / increased volatility in stocks.
On the 2-day chart below something significant has occurred. The index has printed a life cross (green boxes), that is the 50-day EMA (blue line) on the 2-day (so actually a 100-day EMA) has crossed up the 200-day (red line).
What to do? Be risk on, that means long stocks, crypto etc. The index will back test the 50 or 200 in the coming weeks and months. Expecting a rally in both asset classes during this time. When the back test is confirmed, be in cash and ride out the bear market.
Would someone be so kind as to tell me when the back test occurs?! Cheers me dears.
WW
Note
Dollar appears to be breaking support on the weekly. Expect risk assets to benefit in the near term.Disclaimer
The information and publications are not meant to be, and do not constitute, financial, investment, trading, or other types of advice or recommendations supplied or endorsed by TradingView. Read more in the Terms of Use.
Disclaimer
The information and publications are not meant to be, and do not constitute, financial, investment, trading, or other types of advice or recommendations supplied or endorsed by TradingView. Read more in the Terms of Use.