Hello, fellow traders!
Follow us to get the latest information quickly.
Have a great day!
-------------------------------------
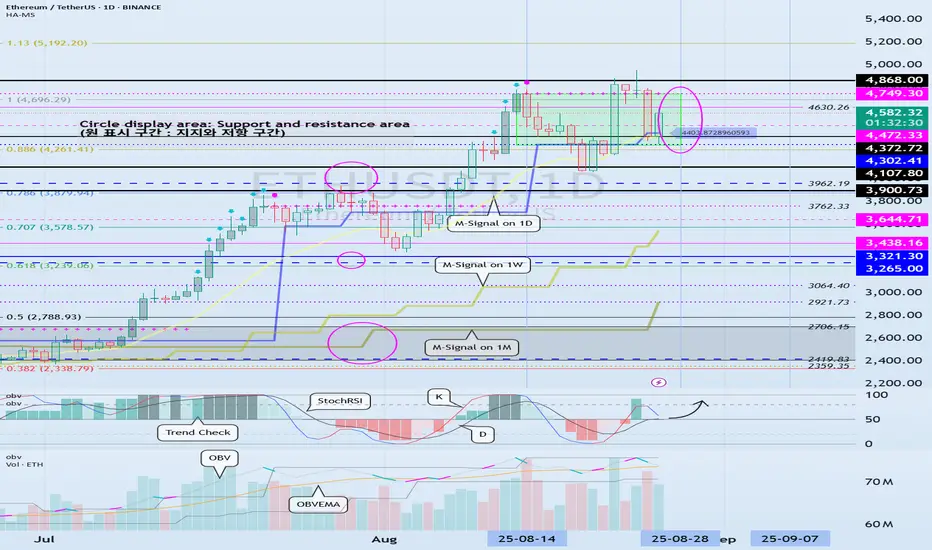
(ETHUSDT 1D chart)
It's rising, with support near 4372.72.
However, since the TC (Trend Check) indicator is at 0, it's unclear where the price will bounce.
Therefore, we need to determine whether support is found around 4630.26 or whether the price falls below 4472.33.
This period of volatility is expected to last from August 27th to 29th.
-
To initiate a cascading upward trend, support must be found around 4749.30.
-
Thank you for reading to the end.
I wish you successful trading.
--------------------------------------------------
- This is an explanation of the big picture.
(3-year bull market, 1-year bear market pattern)

I will explain in more detail when the bear market begins.
------------------------------------------------------
Trade active
#ETHUSDTA light blue arrow (Arrow Down) has formed on the current candle.
This indicates that the price has entered a high range.
Therefore, when a pink Label Down indicator appears, we should check for the formation of the DOM (60) indicator.
The indicator must remain horizontal for at least three candles after formation to most likely function as support and resistance.
While these support and resistance levels don't tell the whole story, they are important because they provide a baseline for determining when to initiate a trade.
As you can see, the 3900.73-4107.80 range is a crucial support level for maintaining this uptrend.
-
ETH met the HA-Low indicator, rose, and broke above the HA-High indicator, rising.
Therefore, if a new HA-High indicator is formed this time, it will test the first support level of the stepwise uptrend.
The basic trading strategy is to buy in the DOM(-60) ~ HA-Low range and sell in the HA-High ~ DOM(60) range.
Note
#ETHUSDTThe HA-High indicator is showing signs of forming at the 4062.94 level.
This confirms that the 3900.73-4107.80 range is an important area.
Therefore, the key question is whether support can be found and an upward movement can occur around the 3900.73-4107.80 range.
※ Follow X to check out the posts.
※ X를 팔로우하고 게시물을 확인하세요.
◆ t.me/readCryptoChannel
[HA-MS Indicator]
bit.ly/3YxHgvN
[OBV Indicator]
bit.ly/4dcyny3
※ X를 팔로우하고 게시물을 확인하세요.
◆ t.me/readCryptoChannel
[HA-MS Indicator]
bit.ly/3YxHgvN
[OBV Indicator]
bit.ly/4dcyny3
Related publications
Disclaimer
The information and publications are not meant to be, and do not constitute, financial, investment, trading, or other types of advice or recommendations supplied or endorsed by TradingView. Read more in the Terms of Use.