Technical Analysis of EURCAD
▪ Market Structure: Bullish Reversal in Progress
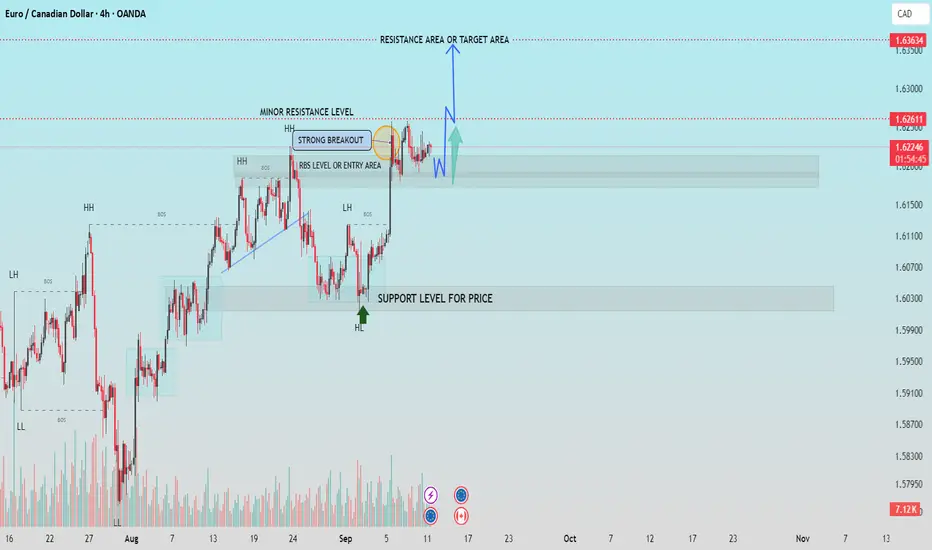
The pair previously formed a series of lower highs (LH) and lower lows (LL), indicating a downtrend.
A break of structure (BOS) followed by a higher low (HL) suggests a potential bullish reversal.
▪ Key Support & Resistance Zones
▫ Support Zone: 1.6000–1.6050
Price respected this level and formed a higher low (HL), confirming it as a strong demand zone.
▫Current Resistance Zone (RBS/Entry Area): 1.6200–1.6260
Price is currently retesting this area after a strong breakout.
▪ Breakout Confirmation
A strong breakout above the minor resistance level occurred with volume support.
Price has pulled back to retest the RBS (Resistance Becomes Support) zone, indicating a potential long entry opportunity.
▪Short-Term Projection
If the RBS zone holds, we can expect a bullish continuation toward the next resistance/target area at 1.6363.
If the zone fails, price may retest the support level near 1.6000 before another potential move higher.
▪ Conclusion
The current market structure and price action suggest a bullish bias. Traders should watch for bullish confirmation in the RBS zone for potential long setups targeting the 1.6363 level.
Support Me For More Insightful Analysis.
▪ Market Structure: Bullish Reversal in Progress
The pair previously formed a series of lower highs (LH) and lower lows (LL), indicating a downtrend.
A break of structure (BOS) followed by a higher low (HL) suggests a potential bullish reversal.
▪ Key Support & Resistance Zones
▫ Support Zone: 1.6000–1.6050
Price respected this level and formed a higher low (HL), confirming it as a strong demand zone.
▫Current Resistance Zone (RBS/Entry Area): 1.6200–1.6260
Price is currently retesting this area after a strong breakout.
▪ Breakout Confirmation
A strong breakout above the minor resistance level occurred with volume support.
Price has pulled back to retest the RBS (Resistance Becomes Support) zone, indicating a potential long entry opportunity.
▪Short-Term Projection
If the RBS zone holds, we can expect a bullish continuation toward the next resistance/target area at 1.6363.
If the zone fails, price may retest the support level near 1.6000 before another potential move higher.
▪ Conclusion
The current market structure and price action suggest a bullish bias. Traders should watch for bullish confirmation in the RBS zone for potential long setups targeting the 1.6363 level.
Support Me For More Insightful Analysis.
Trade active
Trade closed: target reached
💸FREE FOREX Signals in Telegram : t.me/FxInsightsHub0
🔹Join Our Telegram Channel, Pure Price Action Based Signals With Chart Analysis.
t.me/FxInsightsHub0
🚀FREE CRYPTO Signals In Telegram: t.me/FxInsightsHub0
🔹Join Our Telegram Channel, Pure Price Action Based Signals With Chart Analysis.
t.me/FxInsightsHub0
🚀FREE CRYPTO Signals In Telegram: t.me/FxInsightsHub0
Related publications
Disclaimer
The information and publications are not meant to be, and do not constitute, financial, investment, trading, or other types of advice or recommendations supplied or endorsed by TradingView. Read more in the Terms of Use.