## 📈 Analysis of the EUR/JPY Chart Pattern
The 4-hour chart for **EUR/JPY** shows the development of two primary chart patterns, suggesting a potential future price movement:
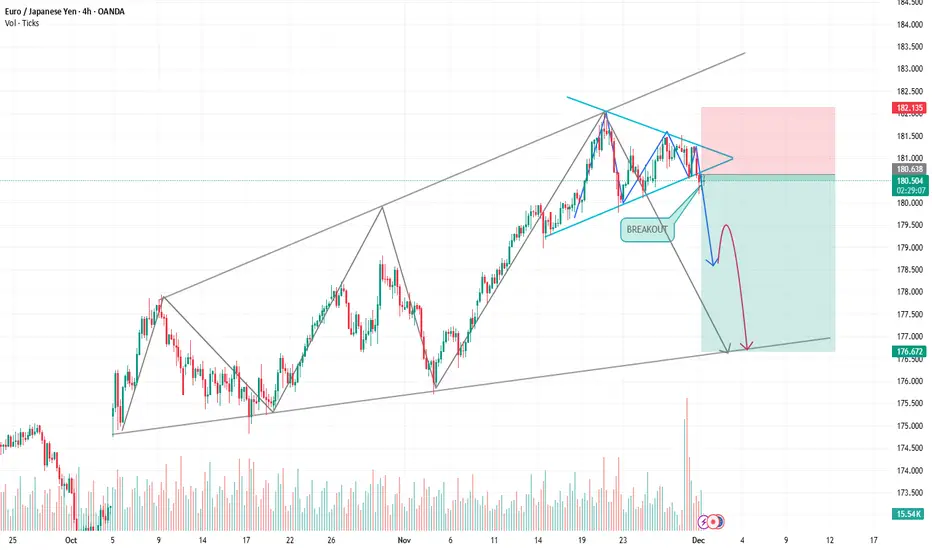
### 1. **Broadening Wedge (The Main Structure)**
The overall price action from late September to the present appears to be contained within a **Broadening Wedge** (also known as a Megaphone pattern).
* **Structure:** This pattern is characterized by two diverging trendlines (one resistance and one support) that expand over time, indicating increasing volatility and uncertainty.
* **Significance:** Broadening wedges are typically considered **reversal patterns** when they appear after a sustained move. In this case, following the overall uptrend from September, the pattern suggests the bullish momentum might be weakening, setting the stage for a reversal.
* **Projected Target:** The lowest trendline of this wedge (around **176.872**) is indicated as the ultimate potential target for the projected downward move.
### 2. **Symmetrical Triangle (The Breakout Setup)**
Immediately preceding the current candle, a smaller **Symmetrical Triangle** pattern developed.
* **Structure:** This pattern forms when price action is constrained by two converging trendlines—a lower high and a higher low—indicating a temporary pause in momentum before a continuation or reversal.
* **The Breakout:** The chart explicitly marks a **"BREAKOUT"** below the lower trendline of this symmetrical triangle.
* **Significance:** A breakout from a symmetrical triangle often signals the direction of the next significant move. The **downward breakout** suggests that sellers have taken control, confirming the pattern's indication of a move lower.
### 📉 **Trading Implications and Projection**
The chart sets up a potential **short trade** based on the confluence of the triangular breakout and the overarching broadening wedge structure:
* **Entry:** The entry appears to be placed just below the breakout area, around **180.593**.
* **Stop-Loss (Risk):** The stop-loss is placed above the recent swing high/triangle resistance at **182.125** (the shaded red area).
* **Target (Reward):** The primary target is the lower trendline of the Broadening Wedge, marked at approximately **176.872** (the shaded green area).
**In summary, the chart indicates a bearish projection for EUR/JPY, expecting the price to drop from the confirmed symmetrical triangle breakout toward the support line of the larger broadening wedge.**
Would you like me to look for any other **patterns** or **key levels** on the EUR/JPY chart?
The 4-hour chart for **EUR/JPY** shows the development of two primary chart patterns, suggesting a potential future price movement:
### 1. **Broadening Wedge (The Main Structure)**
The overall price action from late September to the present appears to be contained within a **Broadening Wedge** (also known as a Megaphone pattern).
* **Structure:** This pattern is characterized by two diverging trendlines (one resistance and one support) that expand over time, indicating increasing volatility and uncertainty.
* **Significance:** Broadening wedges are typically considered **reversal patterns** when they appear after a sustained move. In this case, following the overall uptrend from September, the pattern suggests the bullish momentum might be weakening, setting the stage for a reversal.
* **Projected Target:** The lowest trendline of this wedge (around **176.872**) is indicated as the ultimate potential target for the projected downward move.
### 2. **Symmetrical Triangle (The Breakout Setup)**
Immediately preceding the current candle, a smaller **Symmetrical Triangle** pattern developed.
* **Structure:** This pattern forms when price action is constrained by two converging trendlines—a lower high and a higher low—indicating a temporary pause in momentum before a continuation or reversal.
* **The Breakout:** The chart explicitly marks a **"BREAKOUT"** below the lower trendline of this symmetrical triangle.
* **Significance:** A breakout from a symmetrical triangle often signals the direction of the next significant move. The **downward breakout** suggests that sellers have taken control, confirming the pattern's indication of a move lower.
### 📉 **Trading Implications and Projection**
The chart sets up a potential **short trade** based on the confluence of the triangular breakout and the overarching broadening wedge structure:
* **Entry:** The entry appears to be placed just below the breakout area, around **180.593**.
* **Stop-Loss (Risk):** The stop-loss is placed above the recent swing high/triangle resistance at **182.125** (the shaded red area).
* **Target (Reward):** The primary target is the lower trendline of the Broadening Wedge, marked at approximately **176.872** (the shaded green area).
**In summary, the chart indicates a bearish projection for EUR/JPY, expecting the price to drop from the confirmed symmetrical triangle breakout toward the support line of the larger broadening wedge.**
Would you like me to look for any other **patterns** or **key levels** on the EUR/JPY chart?
Daily Forex Signals & Market Insights 📉📈
Need assistance? We're here to help! 🤝
t.me/Arthur_782
Join Our Telegram Channel Today!
t.me/+3nePmmz1xGk1MzZk
t.me/+PqiIQSFLhtEyZGU0
Need assistance? We're here to help! 🤝
t.me/Arthur_782
Join Our Telegram Channel Today!
t.me/+3nePmmz1xGk1MzZk
t.me/+PqiIQSFLhtEyZGU0
Disclaimer
The information and publications are not meant to be, and do not constitute, financial, investment, trading, or other types of advice or recommendations supplied or endorsed by TradingView. Read more in the Terms of Use.