As seen from the Weekly charts the price has rejected the upper trendline on numerous occasions!. A possible break to the downside is getting more and more apparent. As noted the 50 EMA on the weekly chart can act as a strong dynamic support which lies at the 1.6700 level. This apparently could be our take profit target if the price happens to break to the downside!
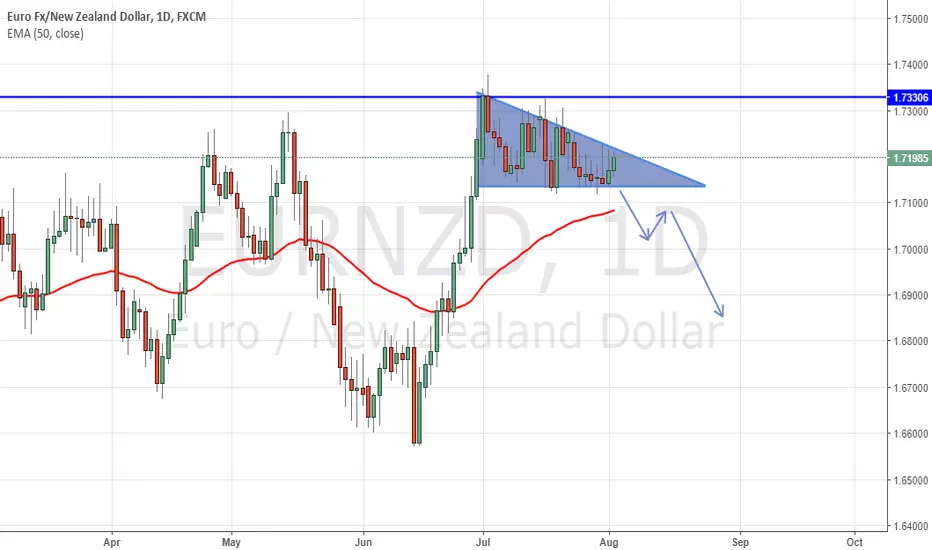
Now coming onto the main daily chart, it can be seen that a flat bottom structure is forming and 1.71200 is being held as a crucial support that needs to be broken in order for us to take the trade. However the daily 50 EMA is also acting as dynamic support that needs to be broken prior to this trade getting executed. Personally i would wait for the daily candle to break and close below both the support and the daily 50 EMA, followed by a retest of the 50 EMA for targeted entry.
The risk reward ratio on this one is favorable as well. It remains to be seen what would happen. If at all there are any updates i will list them below. Cheers
Disclaimer
The information and publications are not meant to be, and do not constitute, financial, investment, trading, or other types of advice or recommendations supplied or endorsed by TradingView. Read more in the Terms of Use.
Disclaimer
The information and publications are not meant to be, and do not constitute, financial, investment, trading, or other types of advice or recommendations supplied or endorsed by TradingView. Read more in the Terms of Use.