Please look at my long-term outlook for gold, and if you like there is a more medium-term chart that has my full (1)-(4) wave count down so far.
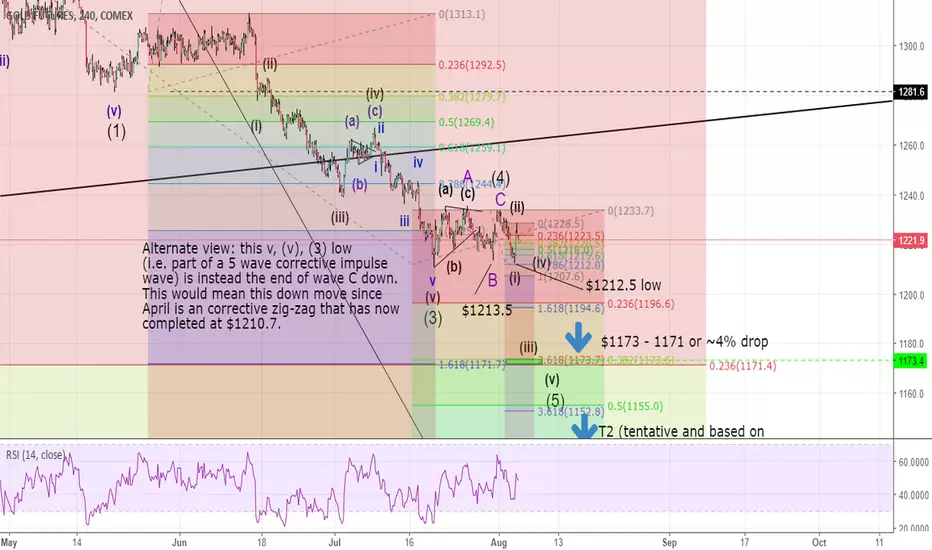
Let me just say that my view could be quickly and definitively invalidated in the bear future. What would invalidate it? The small price pullback of the last few days would end up being wave 2 (or ii) in a larger degree wave C upwards. But let me make my argument first for my bearish view. I don't see the price action recently as just a wave A and B as ABC seem to be present. Another thing that could potentially invalidate, or at least delay, my view is the formation of a double or triple zig-zag correction. If price breaks above $1233.7 in the current up-move, then my view of a smaller degree wave 1 and 2 forming in a future down-move will need to be re-evaluated.
- how it appears to me now; after 2 larger scale down waves ((1) and (3) since the April swing high there has been a zig-zag correction. The price action after that correction has since formed what appears to be a lower low and a partial retrace of that price decline. I see that at the moment as being the foundations of a wave 1 an 2 in a new down-move.
- The new lower low indicates additional correction is required.I
- I also note of quite a large (0.37%) wick showing a rejection of the bulls in what could end up being the wave (ii) extreme.
- If the full move since april has been a zig-zag (which has already completed) then price action indicates that this correction was insufficient and at least another zig-zag is required by the market.
- If the move since april is a 5 sub-wave down-move then we are about to commence wave 5 down to sub-$1200 (conservative as wave 5 in commodities tends towards being extended). After that 5th wave I expect a strong ABC correction in the price upwards in a large ABC move (which moves price back into the $!200s - this is the basis of my medium-term bullish view). On a larger scale these (April - now) waves could form waves A and B, with wave C down still to come. It's not worth charting that scenario yet and a lot of price action will need to develop beforehand. But if this view is correct, it would form a larger scales ABC move that will likely see $1046 broken and end 2016 to present rally in gold.
- If the April to now correction is an ABC zig-zag correction and this is followed by a similar size ABC correction this would mean mid-$1000 prices in a few months.
In previous posts I have elaborated on a longer-term (2 - 4 year) sub $600 view based 100% on technical analysis. If I considered fundamental factors as well, it would be hard to be this bearish. I am not a professional, have only done TA for 6 months and I publish these for my own educational purposes. I have said before that I personally take no joy from my analysis as I know people in the industry that will be affected negatively. If you appreciated this analysis, please add a like. Thanks
Disclaimer
The information and publications are not meant to be, and do not constitute, financial, investment, trading, or other types of advice or recommendations supplied or endorsed by TradingView. Read more in the Terms of Use.
Disclaimer
The information and publications are not meant to be, and do not constitute, financial, investment, trading, or other types of advice or recommendations supplied or endorsed by TradingView. Read more in the Terms of Use.