Based on the technical analysis of Godfrey Phillips India Ltd. (GODFRYPHLP), the stock is showing positive momentum with some mixed signals:
## Price and Performance
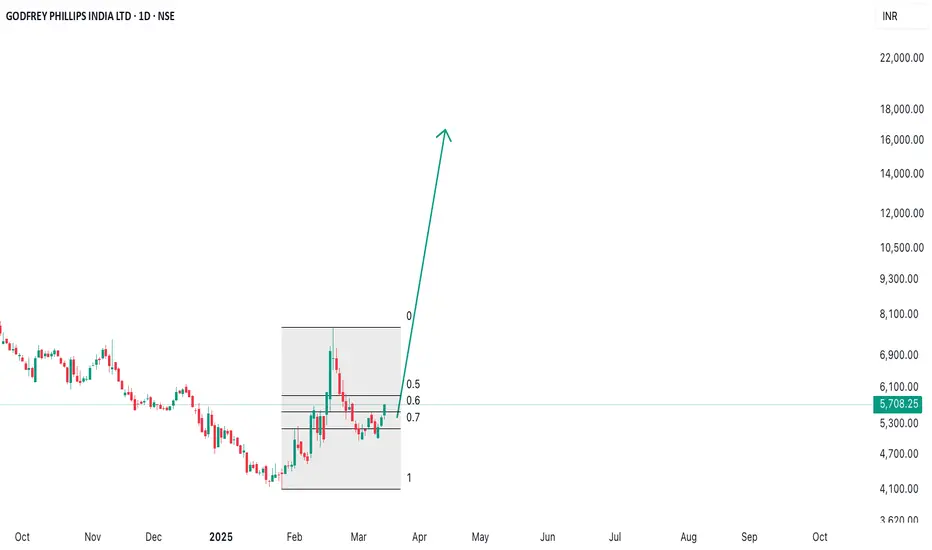
The current stock price is ₹5,708.25, up 5.00% (₹271.80). This indicates strong recent performance and positive market sentiment.
## Technical Indicators
- **RSI**: 55.79, suggesting neutral momentum
- **MACD**: 37.31, indicating a bullish trend
- **ADX**: 18.13, showing a weak trend strength
- **Stochastic**: 19.82, suggesting oversold conditions
- **Williams %R**: -43.69, indicating neutral conditions
## Support and Resistance
The stock has support at ₹4,200 and resistance at ₹8,200. The current price is closer to the support level, suggesting potential for upward movement.
## Volume Analysis
Positive volume balance indicates high volume on days with rising prices and low volume on days with falling prices. This supports the bullish trend.
## Volatility and Beta
The stock has a volatility of 5.79% and a beta coefficient of 1.42. This suggests that GODFRYPHLP is more volatile than the overall market.
## Chart Patterns
The stock has been moving upwards with good speed, but might be retracing. Traders should look for bullish signs near the trendline for potential long positions.
## Overall Outlook
While some indicators show neutral signals, the overall trend appears bullish. Investors should monitor key resistance levels and watch for potential breakouts or consolidations before making trading decisions.
## Price and Performance
The current stock price is ₹5,708.25, up 5.00% (₹271.80). This indicates strong recent performance and positive market sentiment.
## Technical Indicators
- **RSI**: 55.79, suggesting neutral momentum
- **MACD**: 37.31, indicating a bullish trend
- **ADX**: 18.13, showing a weak trend strength
- **Stochastic**: 19.82, suggesting oversold conditions
- **Williams %R**: -43.69, indicating neutral conditions
## Support and Resistance
The stock has support at ₹4,200 and resistance at ₹8,200. The current price is closer to the support level, suggesting potential for upward movement.
## Volume Analysis
Positive volume balance indicates high volume on days with rising prices and low volume on days with falling prices. This supports the bullish trend.
## Volatility and Beta
The stock has a volatility of 5.79% and a beta coefficient of 1.42. This suggests that GODFRYPHLP is more volatile than the overall market.
## Chart Patterns
The stock has been moving upwards with good speed, but might be retracing. Traders should look for bullish signs near the trendline for potential long positions.
## Overall Outlook
While some indicators show neutral signals, the overall trend appears bullish. Investors should monitor key resistance levels and watch for potential breakouts or consolidations before making trading decisions.
Trade active
Disclaimer
The information and publications are not meant to be, and do not constitute, financial, investment, trading, or other types of advice or recommendations supplied or endorsed by TradingView. Read more in the Terms of Use.
Disclaimer
The information and publications are not meant to be, and do not constitute, financial, investment, trading, or other types of advice or recommendations supplied or endorsed by TradingView. Read more in the Terms of Use.