### 🔹 Trend Structure:
1. **Overall Trend:**
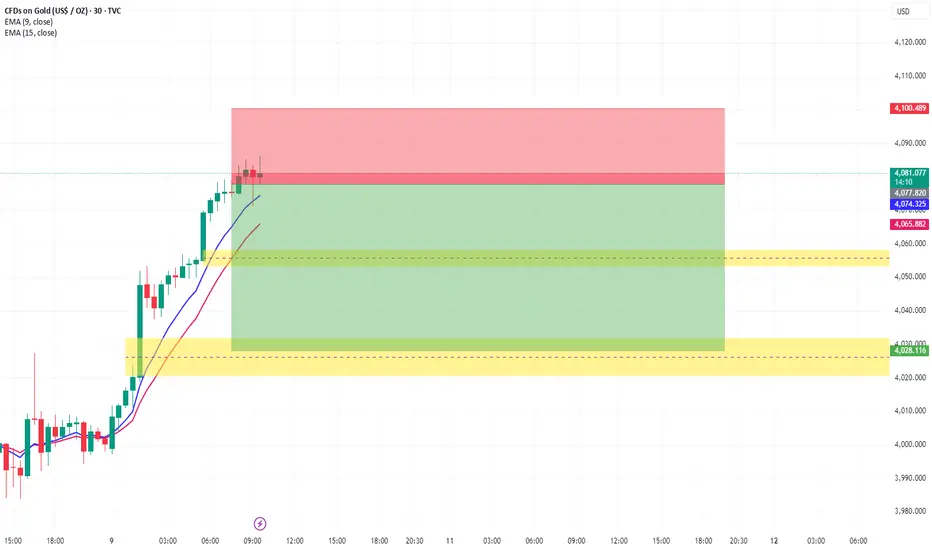
The chart shows a **strong bullish trend** before the current setup — a clear **impulse move up** with higher highs (HH) and higher lows (HL).
2. **Current Market Behavior:**
After a strong bullish leg, the price reached a **resistance zone around 4080–4090**, where you entered a **short (sell)** trade.
* The **red zone** marks your **stop-loss** (above recent highs).
* The **green zone** marks your **target area**, which aligns with a **previous demand zone** (yellow box below).
3. **Key Structures:**
* **Demand Zones (Yellow Boxes):**
These are areas where buying pressure previously pushed the market up — potential retracement or reaction zones.
* **EMA Cross (9 & 15):**
The EMAs are still pointing upward — showing **bullish momentum**, though short-term exhaustion is visible.
* **Possible Pullback Zone:**
Price might retrace to test the **first yellow zone (4055–4065)** or the **second one (4020–4030)** before resuming upward or breaking structure lower.
### 🔹 Structural Summary:
* **Main structure:** Bullish (higher timeframe).
* **Substructure (current 30m leg):** Potential **bearish correction** or **retracement** after overextension.
* **Key confirmation:** A break below **4060 (lower yellow zone)** would signal a **shift to bearish structure** on this timeframe.
Disclaimer
The information and publications are not meant to be, and do not constitute, financial, investment, trading, or other types of advice or recommendations supplied or endorsed by TradingView. Read more in the Terms of Use.
Disclaimer
The information and publications are not meant to be, and do not constitute, financial, investment, trading, or other types of advice or recommendations supplied or endorsed by TradingView. Read more in the Terms of Use.