GOOG Long Idea
Chart Analysis:
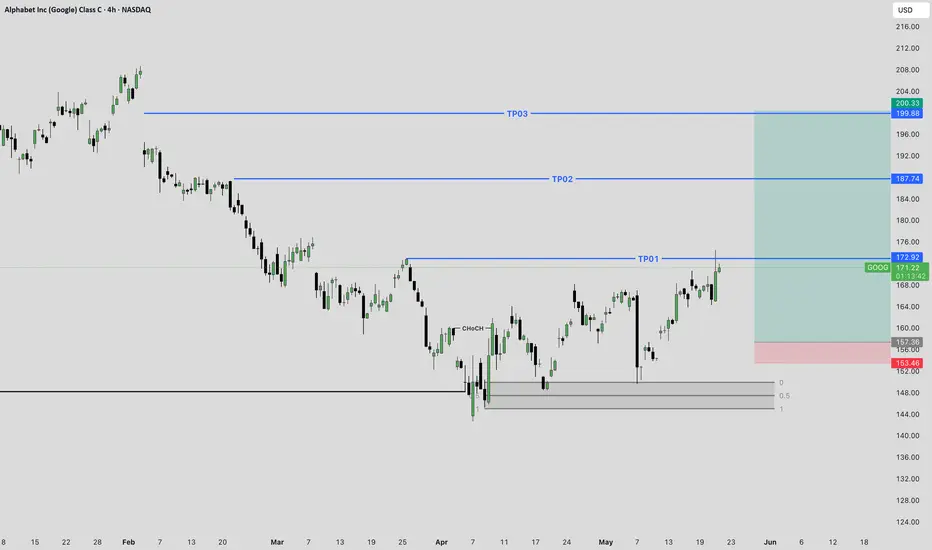
The chart shows Alphabet Inc. (GOOG) on a 4-hour timeframe. After a period of decline from its highs, GOOG appears to be finding support around the "Weekly Liquidity" level. There's also a recent bullish impulse from this area, breaking above some minor resistance. The chart identifies three potential "TP" (Take Profit) levels.
Trading Idea:
Entry: Look for a sustained move above the TP01 level ($172.92) or a clear retest and bounce from the current price area after confirming demand. Given the current price is $171.19, a move above TP01 would confirm further bullish momentum.
Stop Loss: Place a stop loss below the recent lows and the "Weekly Liquidity" zone. The chart suggests a stop loss around $153.48 or $152.00, below the 0.5 and 1 Fibonacci levels from the recent bounce.
Take Profit Targets:
TP01: $172.92 (already near or touched)
TP02: $187.74
TP03: $200.33 - $199.38 (a strong resistance zone)
Rationale:
Weekly Liquidity: The price has found support at a significant weekly liquidity level, suggesting potential for a reversal.
Bullish Structure: The recent price action from the weekly liquidity area shows signs of a bullish structure, with higher lows and a break of minor resistance.
Target Levels: The TP levels are strategically placed at previous resistance zones or significant price levels, offering clear profit targets.
Risk Management:
Risk-Reward: The potential risk-reward ratio for this trade appears favorable if targeting TP02 or TP03.
Position Sizing: Always use appropriate position sizing to manage risk effectively.
Monitor Price Action: Continuously monitor price action for any signs of weakness or reversal, especially around the TP levels.
Disclaimer: This is a trading idea based on the provided chart and should not be considered financial advice. Trading involves substantial risk, and you could lose money. Always conduct your own research and analysis before making any trading decisions.
Chart Analysis:
The chart shows Alphabet Inc. (GOOG) on a 4-hour timeframe. After a period of decline from its highs, GOOG appears to be finding support around the "Weekly Liquidity" level. There's also a recent bullish impulse from this area, breaking above some minor resistance. The chart identifies three potential "TP" (Take Profit) levels.
Trading Idea:
Entry: Look for a sustained move above the TP01 level ($172.92) or a clear retest and bounce from the current price area after confirming demand. Given the current price is $171.19, a move above TP01 would confirm further bullish momentum.
Stop Loss: Place a stop loss below the recent lows and the "Weekly Liquidity" zone. The chart suggests a stop loss around $153.48 or $152.00, below the 0.5 and 1 Fibonacci levels from the recent bounce.
Take Profit Targets:
TP01: $172.92 (already near or touched)
TP02: $187.74
TP03: $200.33 - $199.38 (a strong resistance zone)
Rationale:
Weekly Liquidity: The price has found support at a significant weekly liquidity level, suggesting potential for a reversal.
Bullish Structure: The recent price action from the weekly liquidity area shows signs of a bullish structure, with higher lows and a break of minor resistance.
Target Levels: The TP levels are strategically placed at previous resistance zones or significant price levels, offering clear profit targets.
Risk Management:
Risk-Reward: The potential risk-reward ratio for this trade appears favorable if targeting TP02 or TP03.
Position Sizing: Always use appropriate position sizing to manage risk effectively.
Monitor Price Action: Continuously monitor price action for any signs of weakness or reversal, especially around the TP levels.
Disclaimer: This is a trading idea based on the provided chart and should not be considered financial advice. Trading involves substantial risk, and you could lose money. Always conduct your own research and analysis before making any trading decisions.
Disclaimer
The information and publications are not meant to be, and do not constitute, financial, investment, trading, or other types of advice or recommendations supplied or endorsed by TradingView. Read more in the Terms of Use.
Disclaimer
The information and publications are not meant to be, and do not constitute, financial, investment, trading, or other types of advice or recommendations supplied or endorsed by TradingView. Read more in the Terms of Use.