Stretched Rally Meets Heavy Supply — Time for a Pause?
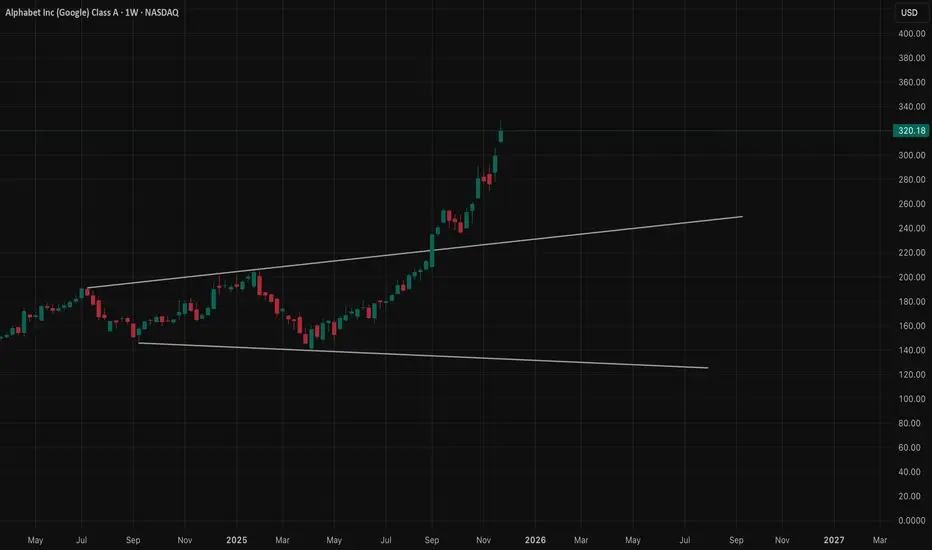
Weekly timeframe (bigger picture mood)
The weekly chart shows a monster trend. GOOGL has been riding this rising channel almost perfectly, and now price is pushing into the upper half of the channel where historically the momentum starts slowing. Candles are still green, but the bodies are getting smaller — that’s usually the market showing fatigue, not reversal. Uptrend still intact, but the push is getting harder.
Daily timeframe (where the slowdown becomes real)

The daily chart lands right inside a clean supply zone around 323–332. Every attempt to break above that zone leaves long wicks. That’s not bearish yet — it just means sellers are active.
Volume dips here confirm one thing: Buyers are getting tired exactly where sellers finally have the upper hand.
Whenever a strong weekly trend pushes into daily supply and stalls, that’s usually the stage before:
* a pause
* a pullback
* or a sloppy sideways grind
Not reversal… just cooling pressure.
1H timeframe (early crack in momentum)

This is where the weakness shows clearly. Price tried to break supply, failed, and started forming lower highs directly underneath the ceiling. That’s how uptrends slow: first the momentum dies, then structure breaks later.
There’s a small CHoCH on the 1H, meaning the market tested the bullish side and then flipped short-term control back to sellers. Trendline is still holding — but barely.
Whenever the 1H starts doing this under daily supply, the bulls usually need a “rest day.”
15m timeframe (the truth surface)

The 15m chart shows the “real” story before everyone sees it:
* Repeated rejections at the same zone
* Break of structure downward
* Retests failing
* And smaller and smaller bounces
This is the type of compression pattern that usually breaks to the downside first before anything else.
The 15m broke early. The 1H is bending. The daily is in supply. The weekly is stretched.
The pieces fit.
How GEX confirms all of this

The GEX chart adds the final piece of evidence. No need to hype — just simple cause & effect:
Major call-wall cluster: 327–335
This is thick resistance from hedging flows. Market makers get forced to hedge against upside when price enters that region, which creates downward pressure.
And guess what? That zone lines up EXACTLY with the daily supply and the rejection levels on 1H and 15m.
Major put-magnet cluster: 312–310
Below, the heaviest put-weight sits around 312–310, which acts like a magnet if price loses 315.
So the GEX map basically says:
* “Upside is heavy and expensive near 327–335.”
* “Downside is easier if 315 breaks.”
Perfect confirmation to the TA.
Trade ideas (based on structure + GEX)
These are not signals — just how a trader would think based on the levels.
BULLISH SCENARIO (only if strength proves itself)
Trigger: Must reclaim 326 with a clean push + retest. If that happens:
Targets:
* 330
* 332 (end of the supply zone)
* 335 (GEX wall — tough to break)
Safer call-side idea (for Dec 6 expiration):
* 325c / 330c spread Tight risk, matches GEX resistance.
Aggressive idea:
* 330c, but only if 326 breaks with volume.
BEARISH SCENARIO (more likely unless buyers show strength)
Trigger: Break below 315 This opens the easier path where both TA and GEX want price to go.
Targets:
* 312
* 310
* 305 (if panic selling kicks in)
Put-side idea (Dec 6 expiration):
* 315p / 310p spread Cheap, logical, and matches the GEX magnet.
Aggressive:
* 310p, aiming for the magnet flush.
NEUTRAL / SCALP IDEA (for those who don’t want directional risk)
Inside the 323–332 supply zone:
* Short calls above 332
* Short puts above 315 …because price is likely to chop until one side breaks.
This reflects the actual structure: compression between supply and short-term support.
My overall view for the week (Dec 1–5)
Everything points to a cooling week, not a runaway rally. Buyers have pushed hard for weeks, and GOOGL is finally running into an area where sellers care again.
Unless 326 breaks clean, this week favors:
* A pause
* A pullback
* Or a choppy range with bearish lean
Break of 315 = quick drop. Break of 326 = one more push.
Disclaimer
This is not financial advice. Educational analysis only — always manage risk according to personal trading rules.
Weekly timeframe (bigger picture mood)
The weekly chart shows a monster trend. GOOGL has been riding this rising channel almost perfectly, and now price is pushing into the upper half of the channel where historically the momentum starts slowing. Candles are still green, but the bodies are getting smaller — that’s usually the market showing fatigue, not reversal. Uptrend still intact, but the push is getting harder.
Daily timeframe (where the slowdown becomes real)
The daily chart lands right inside a clean supply zone around 323–332. Every attempt to break above that zone leaves long wicks. That’s not bearish yet — it just means sellers are active.
Volume dips here confirm one thing: Buyers are getting tired exactly where sellers finally have the upper hand.
Whenever a strong weekly trend pushes into daily supply and stalls, that’s usually the stage before:
* a pause
* a pullback
* or a sloppy sideways grind
Not reversal… just cooling pressure.
1H timeframe (early crack in momentum)
This is where the weakness shows clearly. Price tried to break supply, failed, and started forming lower highs directly underneath the ceiling. That’s how uptrends slow: first the momentum dies, then structure breaks later.
There’s a small CHoCH on the 1H, meaning the market tested the bullish side and then flipped short-term control back to sellers. Trendline is still holding — but barely.
Whenever the 1H starts doing this under daily supply, the bulls usually need a “rest day.”
15m timeframe (the truth surface)
The 15m chart shows the “real” story before everyone sees it:
* Repeated rejections at the same zone
* Break of structure downward
* Retests failing
* And smaller and smaller bounces
This is the type of compression pattern that usually breaks to the downside first before anything else.
The 15m broke early. The 1H is bending. The daily is in supply. The weekly is stretched.
The pieces fit.
How GEX confirms all of this
The GEX chart adds the final piece of evidence. No need to hype — just simple cause & effect:
Major call-wall cluster: 327–335
This is thick resistance from hedging flows. Market makers get forced to hedge against upside when price enters that region, which creates downward pressure.
And guess what? That zone lines up EXACTLY with the daily supply and the rejection levels on 1H and 15m.
Major put-magnet cluster: 312–310
Below, the heaviest put-weight sits around 312–310, which acts like a magnet if price loses 315.
So the GEX map basically says:
* “Upside is heavy and expensive near 327–335.”
* “Downside is easier if 315 breaks.”
Perfect confirmation to the TA.
Trade ideas (based on structure + GEX)
These are not signals — just how a trader would think based on the levels.
BULLISH SCENARIO (only if strength proves itself)
Trigger: Must reclaim 326 with a clean push + retest. If that happens:
Targets:
* 330
* 332 (end of the supply zone)
* 335 (GEX wall — tough to break)
Safer call-side idea (for Dec 6 expiration):
* 325c / 330c spread Tight risk, matches GEX resistance.
Aggressive idea:
* 330c, but only if 326 breaks with volume.
BEARISH SCENARIO (more likely unless buyers show strength)
Trigger: Break below 315 This opens the easier path where both TA and GEX want price to go.
Targets:
* 312
* 310
* 305 (if panic selling kicks in)
Put-side idea (Dec 6 expiration):
* 315p / 310p spread Cheap, logical, and matches the GEX magnet.
Aggressive:
* 310p, aiming for the magnet flush.
NEUTRAL / SCALP IDEA (for those who don’t want directional risk)
Inside the 323–332 supply zone:
* Short calls above 332
* Short puts above 315 …because price is likely to chop until one side breaks.
This reflects the actual structure: compression between supply and short-term support.
My overall view for the week (Dec 1–5)
Everything points to a cooling week, not a runaway rally. Buyers have pushed hard for weeks, and GOOGL is finally running into an area where sellers care again.
Unless 326 breaks clean, this week favors:
* A pause
* A pullback
* Or a choppy range with bearish lean
Break of 315 = quick drop. Break of 326 = one more push.
Disclaimer
This is not financial advice. Educational analysis only — always manage risk according to personal trading rules.
Disclaimer
The information and publications are not meant to be, and do not constitute, financial, investment, trading, or other types of advice or recommendations supplied or endorsed by TradingView. Read more in the Terms of Use.
Disclaimer
The information and publications are not meant to be, and do not constitute, financial, investment, trading, or other types of advice or recommendations supplied or endorsed by TradingView. Read more in the Terms of Use.