### HDFCAMC Price Analysis
#### Current Price and Performance
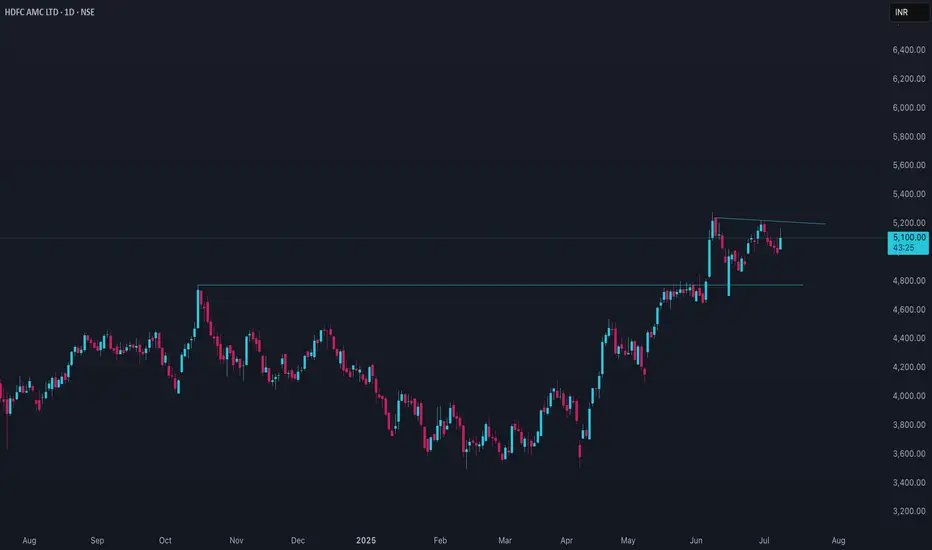
- HDFC Asset Management Company (HDFCAMC) is trading near the ₹5,100–₹5,200 range as of early July 2025.
- The stock has shown notable volatility, with a 52-week high of around ₹5,279 and a low near ₹3,563.
- Over the past year, the stock has delivered a return of about 20%, with a strong rally in the last three months, rising over 30%.
- Short-term momentum has cooled, with the past week and month showing minor declines or sideways movement.
#### Trend and Technical Overview
- The price trend has been positive over the medium term, supported by strong quarterly results and robust assets under management growth.
- Recent technical signals indicate some consolidation, with analysts suggesting caution for new long positions unless the stock sustains above key resistance levels.
- The stock remains moderately volatile, with a beta above 1, indicating higher sensitivity to market movements.
#### Valuation and Financial Metrics
- HDFCAMC trades at a high price-to-earnings (P/E) ratio above 43 and a price-to-book (P/B) ratio above 13, reflecting premium valuations compared to sector averages.
- The dividend yield is around 1.8%, which is attractive for investors seeking regular income.
- The company has a strong balance sheet with zero debt and consistent revenue growth.
#### Market Sentiment and Outlook
- Analyst sentiment is cautiously optimistic, with most recommending holding or buying on dips.
- The company’s fundamentals remain strong, but the stock is considered overvalued by some metrics, suggesting limited immediate upside unless earnings growth accelerates.
- Upcoming earnings reports and market conditions will likely influence the next major price move.
#### Summary
HDFCAMC has demonstrated strong medium-term growth and profitability, but current valuations are high. The stock is consolidating after a sharp rally, and investors may consider waiting for a clearer trend or a better entry point. The long-term outlook remains positive, supported by the company’s market position and financial health.
#### Current Price and Performance
- HDFC Asset Management Company (HDFCAMC) is trading near the ₹5,100–₹5,200 range as of early July 2025.
- The stock has shown notable volatility, with a 52-week high of around ₹5,279 and a low near ₹3,563.
- Over the past year, the stock has delivered a return of about 20%, with a strong rally in the last three months, rising over 30%.
- Short-term momentum has cooled, with the past week and month showing minor declines or sideways movement.
#### Trend and Technical Overview
- The price trend has been positive over the medium term, supported by strong quarterly results and robust assets under management growth.
- Recent technical signals indicate some consolidation, with analysts suggesting caution for new long positions unless the stock sustains above key resistance levels.
- The stock remains moderately volatile, with a beta above 1, indicating higher sensitivity to market movements.
#### Valuation and Financial Metrics
- HDFCAMC trades at a high price-to-earnings (P/E) ratio above 43 and a price-to-book (P/B) ratio above 13, reflecting premium valuations compared to sector averages.
- The dividend yield is around 1.8%, which is attractive for investors seeking regular income.
- The company has a strong balance sheet with zero debt and consistent revenue growth.
#### Market Sentiment and Outlook
- Analyst sentiment is cautiously optimistic, with most recommending holding or buying on dips.
- The company’s fundamentals remain strong, but the stock is considered overvalued by some metrics, suggesting limited immediate upside unless earnings growth accelerates.
- Upcoming earnings reports and market conditions will likely influence the next major price move.
#### Summary
HDFCAMC has demonstrated strong medium-term growth and profitability, but current valuations are high. The stock is consolidating after a sharp rally, and investors may consider waiting for a clearer trend or a better entry point. The long-term outlook remains positive, supported by the company’s market position and financial health.
Trade active
Time to pyramid Disclaimer
The information and publications are not meant to be, and do not constitute, financial, investment, trading, or other types of advice or recommendations supplied or endorsed by TradingView. Read more in the Terms of Use.
Disclaimer
The information and publications are not meant to be, and do not constitute, financial, investment, trading, or other types of advice or recommendations supplied or endorsed by TradingView. Read more in the Terms of Use.