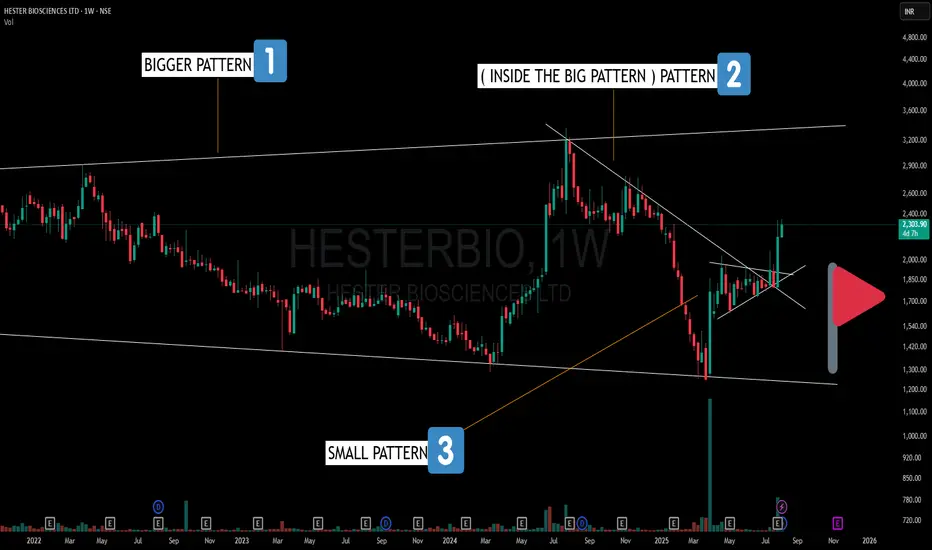
🔍 Here’s what stands out on the Weekly Chart:
1️⃣ Broadening Pattern – Larger structure with higher highs and lower lows, indicating expanding volatility.
2️⃣ Counter Trendline Break – A smaller, random pattern within the broadening formation showing V-shape recoveries and trend shifts.
3️⃣ Bullish Pennant – A compact consolidation pattern just before a strong breakout leg.
This is a great example of how multiple time-frame structures and nested patterns can co-exist—each adding another layer to market behavior.
🎯 Master My Self-Made Trading Strategy
📈 Telegram (Learn Today): t.me/hashtaghammer
✅ WhatsApp (Learn Today): wa.me/919455664601
📈 Telegram (Learn Today): t.me/hashtaghammer
✅ WhatsApp (Learn Today): wa.me/919455664601
Related publications
Disclaimer
The information and publications are not meant to be, and do not constitute, financial, investment, trading, or other types of advice or recommendations supplied or endorsed by TradingView. Read more in the Terms of Use.