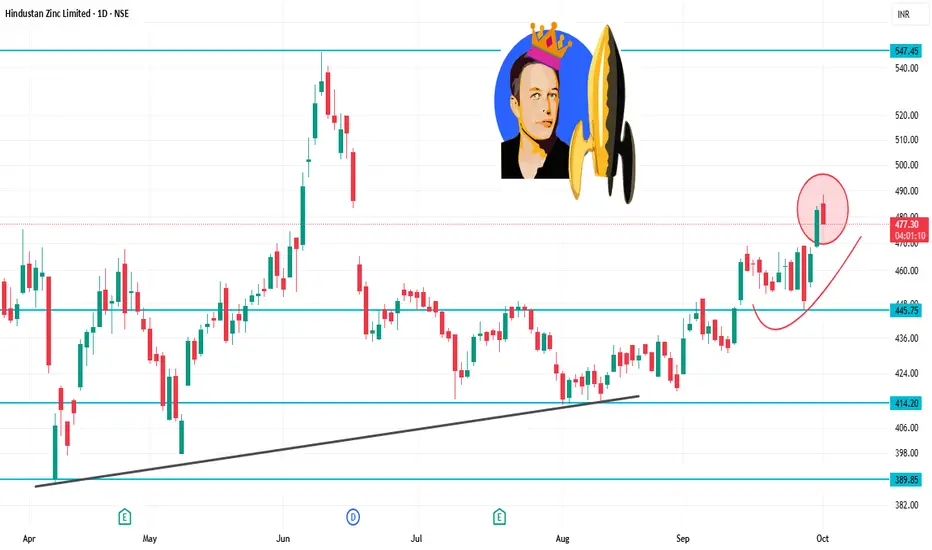
Day Range: ₹478.35 – ₹488.40
52-Week Range: ₹378.15 – ₹575.40
Volume: 284,459 shares traded
📉 Trend Analysis
The stock is in a downtrend, characterized by:
Lower highs and lower lows.
Failure to break above resistance levels.
The short-term trend remains bearish.
🔮 Conclusion
Hindustan Zinc is in a downtrend with weak momentum.
Break below ₹470.00 could lead to further decline toward ₹460.00.
Break above ₹495.00 would indicate a potential trend reversal.
Related publications
Disclaimer
The information and publications are not meant to be, and do not constitute, financial, investment, trading, or other types of advice or recommendations supplied or endorsed by TradingView. Read more in the Terms of Use.
Related publications
Disclaimer
The information and publications are not meant to be, and do not constitute, financial, investment, trading, or other types of advice or recommendations supplied or endorsed by TradingView. Read more in the Terms of Use.