## Trend Overview
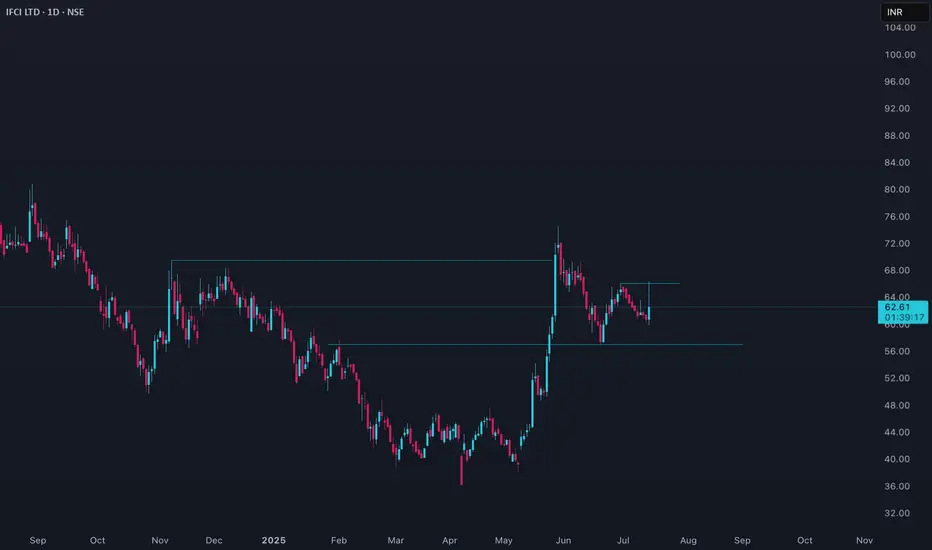
IFCI has shown significant volatility in recent months. After a strong rally earlier in the year, the stock has entered a corrective phase, with the price currently hovering around ₹60.58–₹64.50 as of July 14, 2025. The broader trend over the past year has been negative, but the last quarter displayed a sharp upward move, followed by some consolidation and profit booking.
## Price Action & Momentum
- **Short-Term:** The stock is consolidating after a steep rise in the last three months, where it gained nearly 49%. The recent pullback reflects profit-taking and market caution.
- **Medium-Term:** Despite the recent correction, the price remains above major moving averages, indicating that the medium-term uptrend is still intact.
- **Long-Term:** IFCI is down about 12% over the past year, but up over 534% in three years, highlighting its high volatility and cyclical nature.
## Technical Indicators
- **Moving Averages:** The daily price is above its 50-day and 200-day moving averages, supporting a positive medium-term outlook. Shorter-term averages are converging, suggesting a pause or consolidation.
- **Relative Strength Index (RSI):** The RSI is in the overbought zone, indicating potential for further cooling or sideways movement before the next trend emerges.
- **MACD:** The MACD indicator is positive, but momentum has slowed, suggesting the rally may be losing steam.
- **Volatility:** The stock displays high volatility, with a beta above 2, indicating larger swings compared to the broader market.
## Support and Resistance
- **Immediate Support:** Around ₹60, where recent buying interest has emerged.
- **Major Support:** Near ₹55, which aligns with the 50-day moving average and a previous breakout zone.
- **Immediate Resistance:** Near ₹65, which coincides with recent swing highs.
- **Major Resistance:** The 52-week high at ₹91.40.
## Volume and Sentiment
- Recent sessions have seen increased volume on down days, reflecting profit booking and cautious sentiment.
- Long-term sentiment remains speculative, with traders reacting quickly to momentum shifts and news.
## Summary
IFCI remains a high-beta, volatile stock with a history of sharp rallies and deep corrections. The current daily chart shows consolidation after a strong uptrend, with the price holding above key supports. As long as the stock remains above its 50-day moving average, the medium-term bullish structure is intact. However, the overbought technical indicators and recent profit-taking suggest that short-term movements may remain range-bound or slightly negative until a clear breakout or breakdown occurs. Risk management is crucial given the elevated volatility.
Disclaimer
The information and publications are not meant to be, and do not constitute, financial, investment, trading, or other types of advice or recommendations supplied or endorsed by TradingView. Read more in the Terms of Use.
Disclaimer
The information and publications are not meant to be, and do not constitute, financial, investment, trading, or other types of advice or recommendations supplied or endorsed by TradingView. Read more in the Terms of Use.