echnical analysis often uses chart patterns to identify potential reversals in market trends. One of the most reliable reversal formations is the Head & Shoulders pattern. When inverted, it signals a possible shift from a downtrend to an uptrend. Let’s explore this concept step by step, using the live chart example of IIFL Finance Limited.
🔻 What is a Head & Shoulders Pattern?
The Head & Shoulders is a reversal chart pattern with three distinct troughs (in the inverse version):
Left Shoulder: A decline followed by a short-term rally.
Head: A deeper decline forming the lowest point of the pattern.
Right Shoulder: A shallower decline, followed by another rally.
These troughs are connected by a neckline, which acts as resistance.
In a regular Head & Shoulders, the pattern signals a bearish reversal.
In an inverse Head & Shoulders, the pattern signals a bullish reversal.
📉 Anatomy of the Inverse Head & Shoulders
Formation: Occurs after a downtrend, showing weakening selling pressure.
Neckline Breakout: When price breaks above the neckline, the pattern is considered complete.
Targets:
First Target: Height of the right shoulder projected upward from the breakout point.
Second Target: Height of the head (deepest low) projected upward from the breakout point.
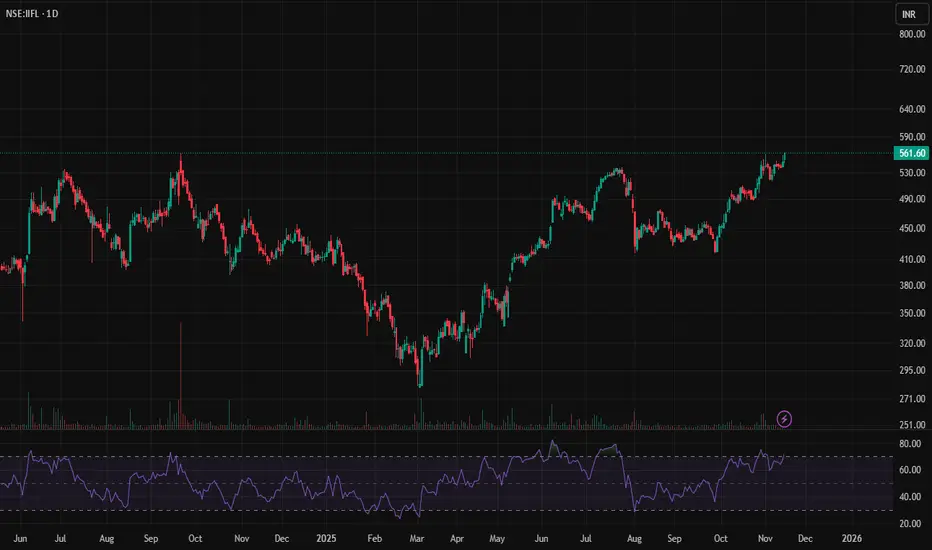
For IIFL Finance Limited:
Current price: ₹561.60
Breakout above neckline: Indicates bullish continuation.
First target: ₹758.00 (height of right shoulder).
Second target: Calculated from the depth of the head, once price sustains above the first target.
📊 RSI (Relative Strength Index) Confirmation
The RSI is a momentum indicator ranging from 0 to 100.
Above 70: Strong bullish momentum.
Between 50–70: Healthy uptrend.
Below 50: Bearish momentum.
In this case:
RSI above 70 confirms strong buying momentum.
This supports the validity of the inverse Head & Shoulders breakout.
It reduces the risk of a false breakout, showing that buyers are firmly in control.
Pattern Invalid if the stock reverse below the Right Shoulder low price point.
🔻 What is a Head & Shoulders Pattern?
The Head & Shoulders is a reversal chart pattern with three distinct troughs (in the inverse version):
Left Shoulder: A decline followed by a short-term rally.
Head: A deeper decline forming the lowest point of the pattern.
Right Shoulder: A shallower decline, followed by another rally.
These troughs are connected by a neckline, which acts as resistance.
In a regular Head & Shoulders, the pattern signals a bearish reversal.
In an inverse Head & Shoulders, the pattern signals a bullish reversal.
📉 Anatomy of the Inverse Head & Shoulders
Formation: Occurs after a downtrend, showing weakening selling pressure.
Neckline Breakout: When price breaks above the neckline, the pattern is considered complete.
Targets:
First Target: Height of the right shoulder projected upward from the breakout point.
Second Target: Height of the head (deepest low) projected upward from the breakout point.
For IIFL Finance Limited:
Current price: ₹561.60
Breakout above neckline: Indicates bullish continuation.
First target: ₹758.00 (height of right shoulder).
Second target: Calculated from the depth of the head, once price sustains above the first target.
📊 RSI (Relative Strength Index) Confirmation
The RSI is a momentum indicator ranging from 0 to 100.
Above 70: Strong bullish momentum.
Between 50–70: Healthy uptrend.
Below 50: Bearish momentum.
In this case:
RSI above 70 confirms strong buying momentum.
This supports the validity of the inverse Head & Shoulders breakout.
It reduces the risk of a false breakout, showing that buyers are firmly in control.
Pattern Invalid if the stock reverse below the Right Shoulder low price point.
Trade active
Posting the chart link below as chart didnt got updated properly while publishing. Refer the link for plotted chartDisclaimer
The information and publications are not meant to be, and do not constitute, financial, investment, trading, or other types of advice or recommendations supplied or endorsed by TradingView. Read more in the Terms of Use.
Disclaimer
The information and publications are not meant to be, and do not constitute, financial, investment, trading, or other types of advice or recommendations supplied or endorsed by TradingView. Read more in the Terms of Use.