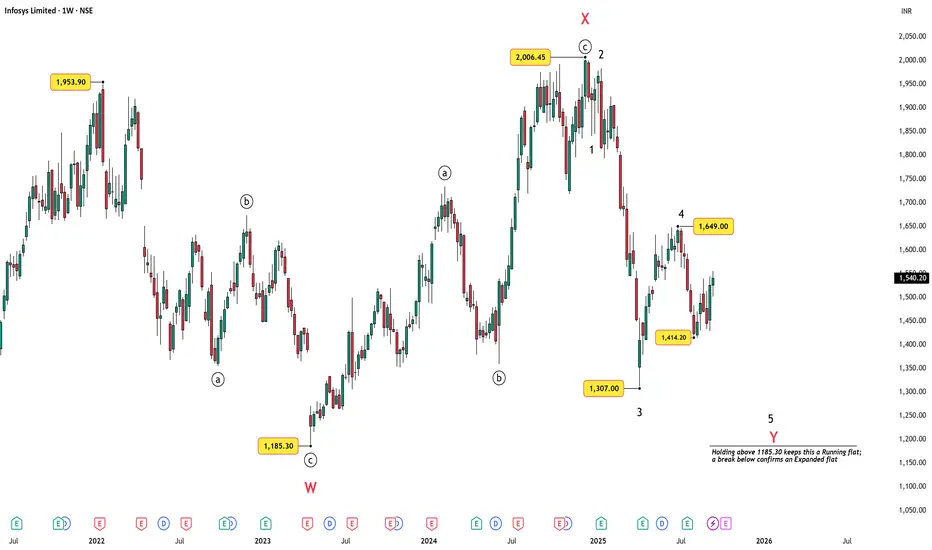
Infosys (NSE: INFY) has been moving within a larger corrective structure after topping near ₹2006. The weekly Elliott Wave count suggests a possible W–X–Y correction, where the Y-leg may be unfolding as a 3-3-5 flat. With prices currently hovering in the mid-1500s, the bigger picture hints at unfinished business on the downside.
Weekly Chart – The Bigger Picture
The weekly count shows:
Key levels to watch:
In simple terms: holding above ₹1185 keeps this a controlled correction, but breaking below it could mean a deeper and more extended decline.
Daily Chart – Zoomed In

On the daily timeframe, the larger Wave 4 looks complete near ₹1649. Infosys has since begun its Wave 5 decline. Within this drop, price found a low at ₹1414.20, which likely marks the end of a smaller Wave 3. The current bounce is best viewed as a smaller Wave 4 inside this ongoing Wave 5.
As long as the stock stays under 1649, the expectation is for Wave 5 to resume down, aligning with the weekly flat structure.
Summary & Key Levels
In short: 1649 is the bearish invalidation, 1414.20 is the immediate watch level, and 1185 is the big-picture decider.
Disclaimer: This analysis is for educational purposes only and does not constitute investment advice. Please do your own research (DYOR) before making any trading decisions.
Weekly Chart – The Bigger Picture
The weekly count shows:
- Wave W completed near ₹1185,
- A strong bounce into Wave X topping at ₹2006,
- And now Wave Y in play, potentially forming a flat correction.
Key levels to watch:
- ₹1307 – the low of Wave 3, which remains the immediate bearish target.
- ₹1185 – the critical level that decides whether this becomes a Running Flat (if held) or an Expanded Flat (if broken).
In simple terms: holding above ₹1185 keeps this a controlled correction, but breaking below it could mean a deeper and more extended decline.
Fundamental Note – U.S. H-1B Visa Shock
Adding to the technical picture, fundamentals just turned heavy. Infosys ADR fell nearly 4% on Friday-Sep 19, after U.S. President signed an executive order imposing a $100,000 fee on new H-1B visa petitions.
Since North America contributes one-third to two-thirds of Indian IT revenues, this sudden spike in visa costs introduces a policy headwind. While not an existential threat, it raises uncertainty for future growth and could act as a catalyst for the bearish structures already visible on the charts.
News source: in.tradingview.com/news/cnbctv:4247a275b094b:0/
Daily Chart – Zoomed In
On the daily timeframe, the larger Wave 4 looks complete near ₹1649. Infosys has since begun its Wave 5 decline. Within this drop, price found a low at ₹1414.20, which likely marks the end of a smaller Wave 3. The current bounce is best viewed as a smaller Wave 4 inside this ongoing Wave 5.
- Price is still capped below the SMA100 and SMA200, both acting as strong resistance.
- RSI at ~58 shows mid-range momentum, leaving room for the final Wave 5 leg to extend lower.
- The key structural invalidation remains ₹1649. Any sustained move above this level would negate the bearish count.
As long as the stock stays under 1649, the expectation is for Wave 5 to resume down, aligning with the weekly flat structure.
Summary & Key Levels
- The weekly and daily charts together point to a bearish bias in Infosys. The larger corrective W–X–Y flat is still in play, and the stock has already rolled into Wave 5 down.
- Short-term: A smaller Wave 4 bounce is underway, but unless price clears ₹1649, the expectation is for a continuation lower.
- Medium-term: A retest of ₹1414.20 is likely, with scope for an extension toward ₹1307.
- Long-term pivot: Holding above ₹1185 keeps the structure a Running Flat; a break below it would confirm an Expanded Flat.
In short: 1649 is the bearish invalidation, 1414.20 is the immediate watch level, and 1185 is the big-picture decider.
Disclaimer: This analysis is for educational purposes only and does not constitute investment advice. Please do your own research (DYOR) before making any trading decisions.
WaveXplorer | Elliott Wave insights
📊 X profile: @veerappa89
📊 X profile: @veerappa89
Related publications
Disclaimer
The information and publications are not meant to be, and do not constitute, financial, investment, trading, or other types of advice or recommendations supplied or endorsed by TradingView. Read more in the Terms of Use.