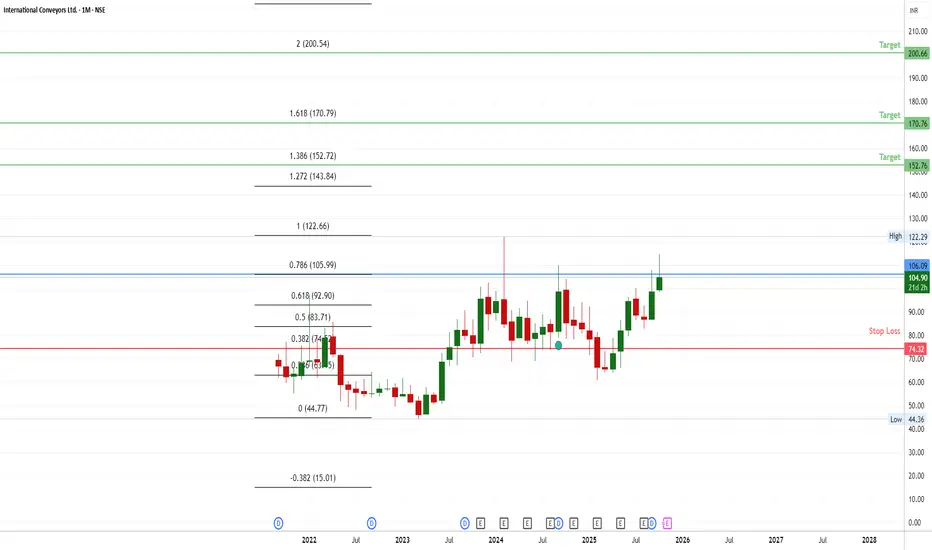
📌 Current Level: 105 (0.786 Fibonacci)
The market is hovering near this critical resistance level. A break above could signal bullish momentum.
📌 Upside Targets: 150 / 170 / 200
If the level of 105 is breached, these are the key retracement levels where price may find resistance next.
📌 Stop Loss: 74 (0.382 Fibonacci)
If the market reverses and falls below this level, it indicates a potential bearish move, making this a safe exit point.
Disclaimer
The information and publications are not meant to be, and do not constitute, financial, investment, trading, or other types of advice or recommendations supplied or endorsed by TradingView. Read more in the Terms of Use.
Disclaimer
The information and publications are not meant to be, and do not constitute, financial, investment, trading, or other types of advice or recommendations supplied or endorsed by TradingView. Read more in the Terms of Use.