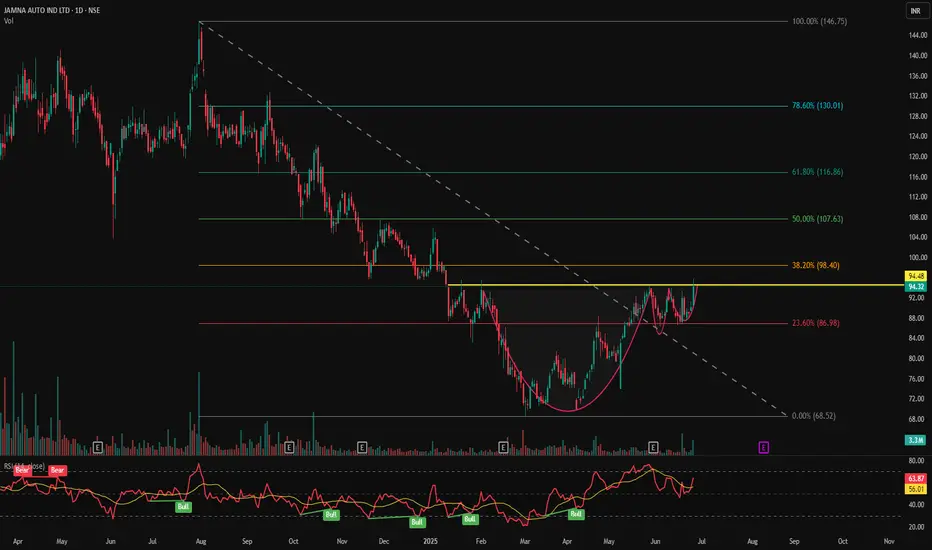
📊 JAMNA AUTO (JAMNAAUTO) – VCP Pattern Near Breakout | RSI Momentum | Volume Surge | Daily Chart
📅 Chart Date: June 26, 2025
📈 CMP: ₹94.32 (+4.60%)
📍 Ticker: NSE:JAMNAAUTO
🔍 Technical Analysis Summary
☕ Cup & Handle Formation
The chart shows a well-formed Cup & Handle pattern
Neckline resistance at ₹94.48 – a break above this zone could trigger bullish continuation
Pattern suggests accumulation and breakout setup after prolonged downtrend reversal
📈 Volume
Rising volume on recent candles, supporting strength of potential breakout
Volume above 3.3M confirms strong buying interest
📊 RSI Indicator (14)
RSI currently at 63.87 and rising
Multiple historical RSI Bullish crossovers visible during base and handle formation
RSI > 60 indicates momentum is favoring bulls
📍 Key Price Levels
✅ Breakout Zone (Neckline): ₹94.48
🚀 Upside Targets (Post-breakout estimate):
₹102
₹110
₹120+
🛡️ Support Zones:
₹90 (immediate)
₹85 (handle base)
₹80 (cup base)
📌 Trade Setup Idea
Entry: On breakout above ₹94.50 with volume
SL: Below ₹89
Targets: ₹102 → ₹110 → ₹120+
Risk-Reward: Good, considering rounded base and handle plus RSI confirmation
⚠️ Disclaimer
This chart analysis is for educational purposes only. Always DYOR (Do Your Own Research) and consult a financial advisor before making investment decisions.
Disclaimer
The information and publications are not meant to be, and do not constitute, financial, investment, trading, or other types of advice or recommendations supplied or endorsed by TradingView. Read more in the Terms of Use.
Disclaimer
The information and publications are not meant to be, and do not constitute, financial, investment, trading, or other types of advice or recommendations supplied or endorsed by TradingView. Read more in the Terms of Use.