Technical analysis often relies on price patterns and momentum indicators to identify potential reversals or continuations in market trends. One of the most widely studied formations is the downtrend channel, which helps traders visualize bearish momentum and anticipate possible turning points. Let’s break this down step by step using the live chart example of JSW Holdings Limited.
🔻 What is a Downtrend Channel?
A downtrend channel is formed when price consistently makes:
Lower Highs (LH): Each rally peaks lower than the previous one.
Lower Lows (LL): Each decline bottoms lower than the previous one.
These points are connected by two parallel lines:
Resistance Line (Upper Boundary): Drawn by connecting the series of lower highs.
Support Line (Lower Boundary): Drawn by connecting the series of lower lows.
This structure visually represents a bearish trend where sellers dominate, pushing prices lower over time.
📉 Characteristics of a Downtrend Channel
Price oscillates between the upper resistance and lower support lines.
Each attempt to rise is capped by the resistance line.
Each decline extends to or below the support line.
Volume often contracts during the channel, reflecting indecision or consolidation within the bearish move.
🚀 Breakout Above the Channel
When price breaks above the resistance line, it signals a potential trend reversal.
Key points to note:
Higher Highs (HH): If the breakout is followed by a rally that surpasses the last lower high, the market begins forming higher highs.
Higher Lows (HL): If subsequent pullbacks stop above previous lows, the market establishes higher lows.
Together, HH + HL = new uptrend channel formation.
This transition marks the shift from bearish control to bullish momentum.
📊 Role of RSI (Relative Strength Index)
The RSI is a momentum oscillator ranging from 0 to 100.
Below 50: Indicates bearish momentum.
Above 50: Suggests bullish momentum.
Breakout Confirmation: When RSI rises above 50 during a breakout, it strengthens the case for a trend reversal.
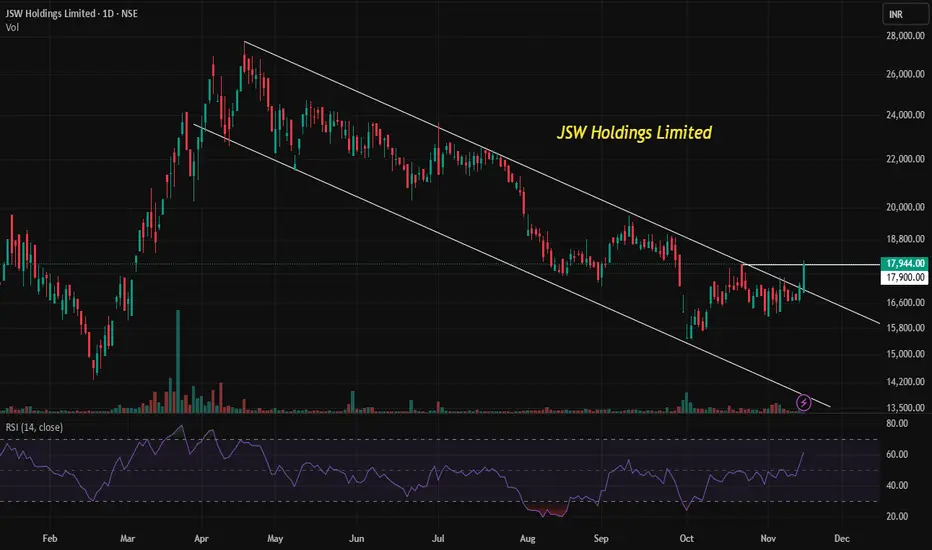
In the case of JSW Holdings Limited:
RSI above 50 confirms bullish momentum.
Breakout accompanied by volume adds conviction, showing strong buying interest rather than a false breakout.
📝 Putting It All Together
Downtrend Channel: April–October 2025 saw JSW Holdings forming lower highs and lower lows.
Breakout: Price has now moved above the resistance line, attempting to surpass its last lower high.
Trend Reversal: If successful, the stock will begin forming higher highs and higher lows, signaling the start of a new uptrend channel.
RSI Confirmation: With RSI above 50 and breakout supported by volume, bullish momentum is validated.
🎯 Educational Takeaway
A downtrend channel helps traders identify bearish phases.
A breakout above resistance is a critical signal of potential reversal.
The higher high, higher low sequence confirms the birth of a new uptrend.
RSI above 50 and volume support act as reliable confirmation tools, reducing the risk of false signals.
🔻 What is a Downtrend Channel?
A downtrend channel is formed when price consistently makes:
Lower Highs (LH): Each rally peaks lower than the previous one.
Lower Lows (LL): Each decline bottoms lower than the previous one.
These points are connected by two parallel lines:
Resistance Line (Upper Boundary): Drawn by connecting the series of lower highs.
Support Line (Lower Boundary): Drawn by connecting the series of lower lows.
This structure visually represents a bearish trend where sellers dominate, pushing prices lower over time.
📉 Characteristics of a Downtrend Channel
Price oscillates between the upper resistance and lower support lines.
Each attempt to rise is capped by the resistance line.
Each decline extends to or below the support line.
Volume often contracts during the channel, reflecting indecision or consolidation within the bearish move.
🚀 Breakout Above the Channel
When price breaks above the resistance line, it signals a potential trend reversal.
Key points to note:
Higher Highs (HH): If the breakout is followed by a rally that surpasses the last lower high, the market begins forming higher highs.
Higher Lows (HL): If subsequent pullbacks stop above previous lows, the market establishes higher lows.
Together, HH + HL = new uptrend channel formation.
This transition marks the shift from bearish control to bullish momentum.
📊 Role of RSI (Relative Strength Index)
The RSI is a momentum oscillator ranging from 0 to 100.
Below 50: Indicates bearish momentum.
Above 50: Suggests bullish momentum.
Breakout Confirmation: When RSI rises above 50 during a breakout, it strengthens the case for a trend reversal.
In the case of JSW Holdings Limited:
RSI above 50 confirms bullish momentum.
Breakout accompanied by volume adds conviction, showing strong buying interest rather than a false breakout.
📝 Putting It All Together
Downtrend Channel: April–October 2025 saw JSW Holdings forming lower highs and lower lows.
Breakout: Price has now moved above the resistance line, attempting to surpass its last lower high.
Trend Reversal: If successful, the stock will begin forming higher highs and higher lows, signaling the start of a new uptrend channel.
RSI Confirmation: With RSI above 50 and breakout supported by volume, bullish momentum is validated.
🎯 Educational Takeaway
A downtrend channel helps traders identify bearish phases.
A breakout above resistance is a critical signal of potential reversal.
The higher high, higher low sequence confirms the birth of a new uptrend.
RSI above 50 and volume support act as reliable confirmation tools, reducing the risk of false signals.
Disclaimer
The information and publications are not meant to be, and do not constitute, financial, investment, trading, or other types of advice or recommendations supplied or endorsed by TradingView. Read more in the Terms of Use.
Disclaimer
The information and publications are not meant to be, and do not constitute, financial, investment, trading, or other types of advice or recommendations supplied or endorsed by TradingView. Read more in the Terms of Use.