📊 KALYANI STEELS LTD (KSL) – Strong Cup & Handle Breakout | Volume & RSI Confirmation | Daily Chart
📅 Chart Date: June 17, 2025
📈 CMP: ₹891.00 (+10.33%)
📍 Ticker: NSE:KSL
🔍 Technical Chart Breakdown
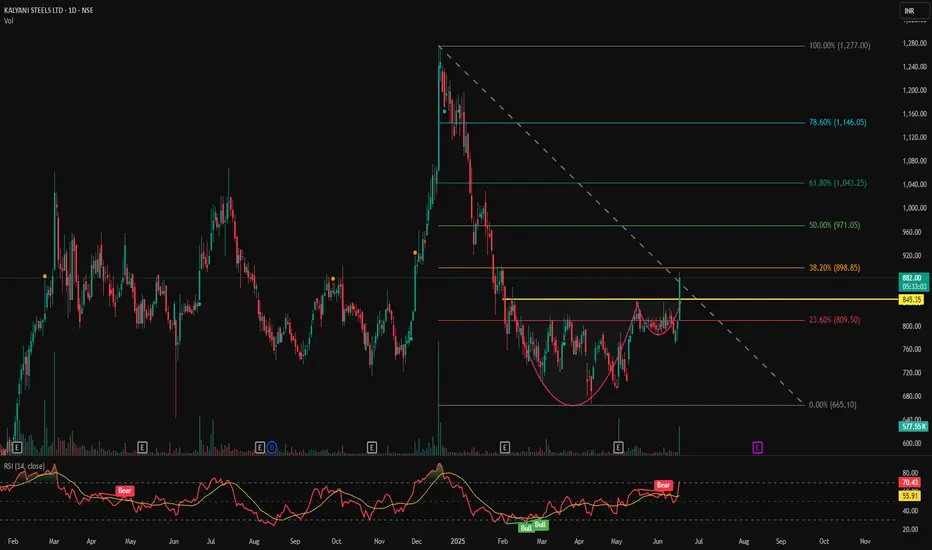
☕ Cup & Handle Pattern Breakout
KSL has decisively broken above the neckline resistance around ₹845 after forming a classic Cup & Handle pattern — a strong bullish continuation setup. This breakout has been accompanied by a solid volume spike (458.32K), which adds further confirmation.
💹 RSI Analysis
RSI is currently at 71.61, indicating strong bullish momentum.
RSI crossover confirms entry into the overbought zone, signaling strength but also requiring caution for late entries.
🕯️ Volume Action
Noticeable volume surge on the breakout candle suggests institutional participation.
Previous volume build-up near the handle zone indicates accumulation.
📍 Key Price Levels
✅ Breakout Zone: ₹845.35
🚀 Potential Upside Targets:
₹920 – Minor resistance
₹990–₹1,040 – Short to medium-term swing targets
₹1,150+ – Based on measured pattern height
🛡️ Support Zones:
₹845 – breakout retest level
₹800 – psychological support
₹765 – handle base and invalidation zone
🛠️ Trading Strategy Idea
Entry: Either breakout close above ₹845 or on retest of breakout zone
Stop Loss: Below ₹800
Targets: ₹920 → ₹1,000 → ₹1,150
Risk-Reward: >1:2 on first target with strong technical validation
📅 Chart Date: June 17, 2025
📈 CMP: ₹891.00 (+10.33%)
📍 Ticker: NSE:KSL
🔍 Technical Chart Breakdown
☕ Cup & Handle Pattern Breakout
KSL has decisively broken above the neckline resistance around ₹845 after forming a classic Cup & Handle pattern — a strong bullish continuation setup. This breakout has been accompanied by a solid volume spike (458.32K), which adds further confirmation.
💹 RSI Analysis
RSI is currently at 71.61, indicating strong bullish momentum.
RSI crossover confirms entry into the overbought zone, signaling strength but also requiring caution for late entries.
🕯️ Volume Action
Noticeable volume surge on the breakout candle suggests institutional participation.
Previous volume build-up near the handle zone indicates accumulation.
📍 Key Price Levels
✅ Breakout Zone: ₹845.35
🚀 Potential Upside Targets:
₹920 – Minor resistance
₹990–₹1,040 – Short to medium-term swing targets
₹1,150+ – Based on measured pattern height
🛡️ Support Zones:
₹845 – breakout retest level
₹800 – psychological support
₹765 – handle base and invalidation zone
🛠️ Trading Strategy Idea
Entry: Either breakout close above ₹845 or on retest of breakout zone
Stop Loss: Below ₹800
Targets: ₹920 → ₹1,000 → ₹1,150
Risk-Reward: >1:2 on first target with strong technical validation
Trade closed: target reached
The first resistance level has been touched. If the trend is to continue, it's important to follow a trailing stop-loss strategy and patiently wait for the price to approach the second resistance level.Disclaimer
The information and publications are not meant to be, and do not constitute, financial, investment, trading, or other types of advice or recommendations supplied or endorsed by TradingView. Read more in the Terms of Use.
Disclaimer
The information and publications are not meant to be, and do not constitute, financial, investment, trading, or other types of advice or recommendations supplied or endorsed by TradingView. Read more in the Terms of Use.