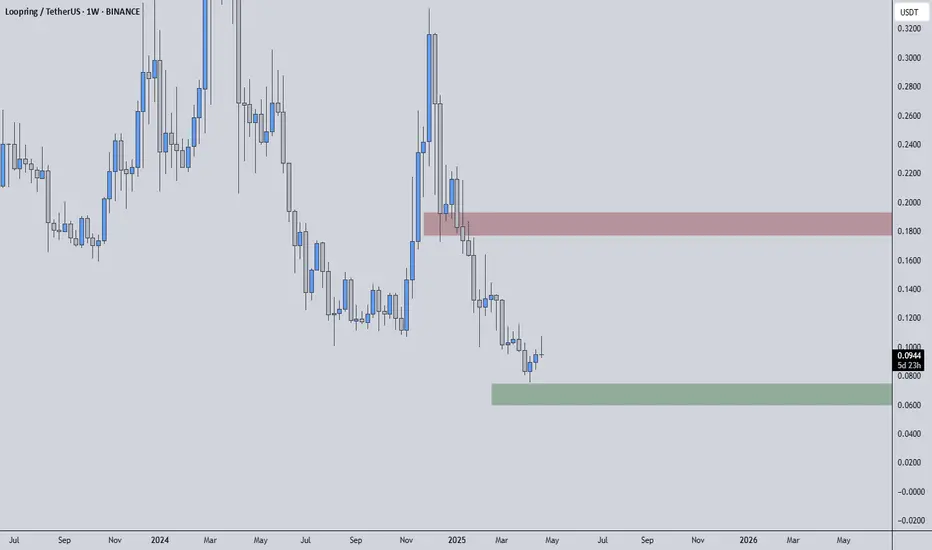
LRCUSDT is trading between clearly defined zones, where the red box acts as a significant resistance and the green box serves as a mild support level. However, the critical detail here is that the support does not appear very reliable — and that should make you extra cautious if you're planning to long from there.
🔴 Resistance: Respect the Sellers
The red box is a zone where sellers have previously stepped in and where supply could easily overwhelm demand again. If price approaches this region and starts to struggle, short opportunities can be considered — but only with confirmation on lower time frames. Think exhaustion candles, failed breakouts, and lack of volume follow-through.
🟢 Support: Don’t Get Too Comfortable
Yes, the green box might offer a small reaction zone, but this isn’t the kind of support you marry — it’s the kind you date briefly. If the price drops and finds temporary footing there, scalps or short-term longs might work, but you should not be expecting major reversals unless significant volume and structure change show up.
🧠 Mental Model:
If price hits the green box and breaks below, don’t hold on hoping for a miracle. Let go fast.
If price reaches the red box and confirms rejection, lean into the short with a tight stop.
If the red box breaks and holds above, especially with volume and bullish orderflow, that’s your cue to flip the bias and ride the move higher with a new mindset.
Remember, trading is a game of adaptation, not ego. Stick to structure, wait for your confirmations, and stay emotion-free in your decisions.
📌I keep my charts clean and simple because I believe clarity leads to better decisions.
📌My approach is built on years of experience and a solid track record. I don’t claim to know it all but I’m confident in my ability to spot high-probability setups.
📌If you would like to learn how to use the heatmap, cumulative volume delta and volume footprint techniques that I use below to determine very accurate demand regions, you can send me a private message. I help anyone who wants it completely free of charge.
🔑I have a long list of my proven technique below:
I stopped adding to the list because it's kinda tiring to add 5-10 charts in every move but you can check my profile and see that it goes on..
🔴 Resistance: Respect the Sellers
The red box is a zone where sellers have previously stepped in and where supply could easily overwhelm demand again. If price approaches this region and starts to struggle, short opportunities can be considered — but only with confirmation on lower time frames. Think exhaustion candles, failed breakouts, and lack of volume follow-through.
🟢 Support: Don’t Get Too Comfortable
Yes, the green box might offer a small reaction zone, but this isn’t the kind of support you marry — it’s the kind you date briefly. If the price drops and finds temporary footing there, scalps or short-term longs might work, but you should not be expecting major reversals unless significant volume and structure change show up.
🧠 Mental Model:
If price hits the green box and breaks below, don’t hold on hoping for a miracle. Let go fast.
If price reaches the red box and confirms rejection, lean into the short with a tight stop.
If the red box breaks and holds above, especially with volume and bullish orderflow, that’s your cue to flip the bias and ride the move higher with a new mindset.
Remember, trading is a game of adaptation, not ego. Stick to structure, wait for your confirmations, and stay emotion-free in your decisions.
📌I keep my charts clean and simple because I believe clarity leads to better decisions.
📌My approach is built on years of experience and a solid track record. I don’t claim to know it all but I’m confident in my ability to spot high-probability setups.
📌If you would like to learn how to use the heatmap, cumulative volume delta and volume footprint techniques that I use below to determine very accurate demand regions, you can send me a private message. I help anyone who wants it completely free of charge.
🔑I have a long list of my proven technique below:
- 🎯 ZENUSDT.P: Patience & Profitability | %230 Reaction from the Sniper Entry
- 🐶 DOGEUSDT.P: Next Move
- 🎨 RENDERUSDT.P: Opportunity of the Month
- 💎 ETHUSDT.P: Where to Retrace
- 🟢 BNBUSDT.P: Potential Surge
- 📊 BTC Dominance: Reaction Zone
- 🌊 WAVESUSDT.P: Demand Zone Potential
- 🟣 UNIUSDT.P: Long-Term Trade
- 🔵 XRPUSDT.P: Entry Zones
- 🔗 LINKUSDT.P: Follow The River
- 📈 BTCUSDT.P: Two Key Demand Zones
- 🟩 POLUSDT: Bullish Momentum
- 🌟 PENDLEUSDT.P: Where Opportunity Meets Precision
- 🔥 BTCUSDT.P: Liquidation of Highly Leveraged Longs
- 🌊 SOLUSDT.P: SOL's Dip - Your Opportunity
- 🐸 1000PEPEUSDT.P: Prime Bounce Zone Unlocked
- 🚀 ETHUSDT.P: Set to Explode - Don't Miss This Game Changer
- 🤖 IQUSDT: Smart Plan
- ⚡️ PONDUSDT: A Trade Not Taken Is Better Than a Losing One
- 💼 STMXUSDT: 2 Buying Areas
- 🐢 TURBOUSDT: Buy Zones and Buyer Presence
- 🌍 ICPUSDT.P: Massive Upside Potential | Check the Trade Update For Seeing Results
- 🟠 IDEXUSDT: Spot Buy Area | %26 Profit if You Trade with MSB
- 📌 USUALUSDT: Buyers Are Active + %70 Profit in Total
- 🌟 FORTHUSDT: Sniper Entry +%26 Reaction
- 🐳 QKCUSDT: Sniper Entry +%57 Reaction
- 📊 BTC.D: Retest of Key Area Highly Likely
- 📊 XNOUSDT %80 Reaction with a Simple Blue Box!
- 📊 BELUSDT Amazing %120 Reaction!
I stopped adding to the list because it's kinda tiring to add 5-10 charts in every move but you can check my profile and see that it goes on..
Professional Day Trader
Microstructure Practicioner
t.me/umuttrades
Microstructure Practicioner
t.me/umuttrades
Related publications
Disclaimer
The information and publications are not meant to be, and do not constitute, financial, investment, trading, or other types of advice or recommendations supplied or endorsed by TradingView. Read more in the Terms of Use.