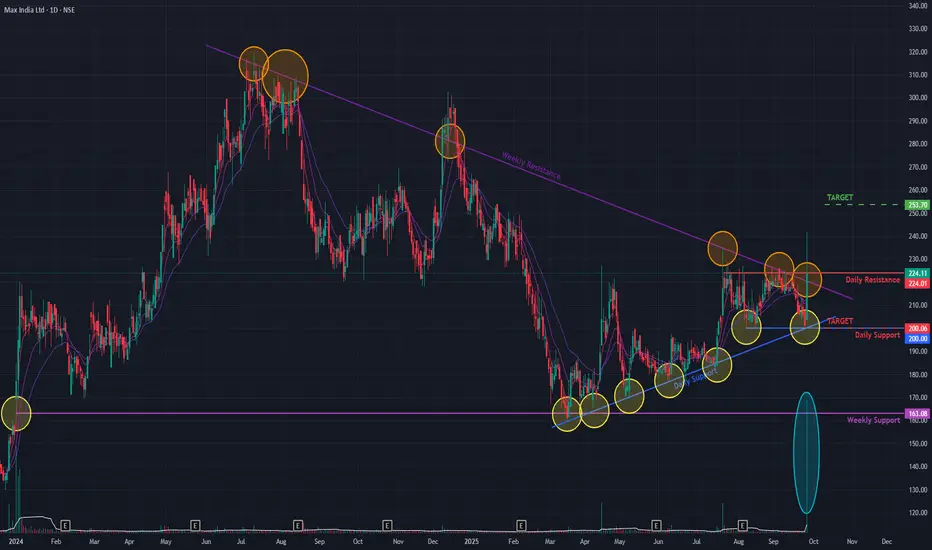
Max India has shown a significant bullish development, decisively breaking out of two key resistance levels today. The stock breached both a long-term angular resistance trendline from July 2024 and a short-term resistance from July 2025. This powerful move was confirmed by a massive surge of +14.95% on the back of exceptionally high trading volume, with the stock closing at ₹224.11.
This breakout signals a potential acceleration of the reversal that began in March 2025, following a prolonged downtrend from the stock's All-Time High in July 2024.
A Mix of Bullish Indicators 👍
The technical landscape shows a confluence of positive signals, although some are still developing:
- Broad Momentum: The Relative Strength Index (RSI) is in a bullish crossover state on both the weekly and daily charts, confirming strong momentum.
- Long-Term Strength: A Golden Crossover appeared on the daily chart a few days ago, providing a strong long-term bullish signal.
- Developing Confirmation: While short-term Exponential Moving Averages (EMAs) show a bullish crossover on the weekly chart, they have not yet confirmed this on the daily timeframe, suggesting immediate-term momentum is still catching up.
Outlook: Awaiting Confirmation
While the breakout is powerful, re-confirmation is prudent. A common technical event is a retest of the broken resistance levels as new support.
- Bullish Case 📈: If the momentum continues and the breakout is sustained, the next potential target on the upside is the ₹250 resistance level.
- Bearish Case 📉: If the breakout fails to hold and momentum subsides, the stock could pull back to find support near the ₹200 level.
Disclaimer: This analysis is my personal view & for educational purposes only. They shall not be construed as trade or investment advice. Before making any financial decision, it is imperative that you consult with a qualified financial professional.
Disclaimer
The information and publications are not meant to be, and do not constitute, financial, investment, trading, or other types of advice or recommendations supplied or endorsed by TradingView. Read more in the Terms of Use.