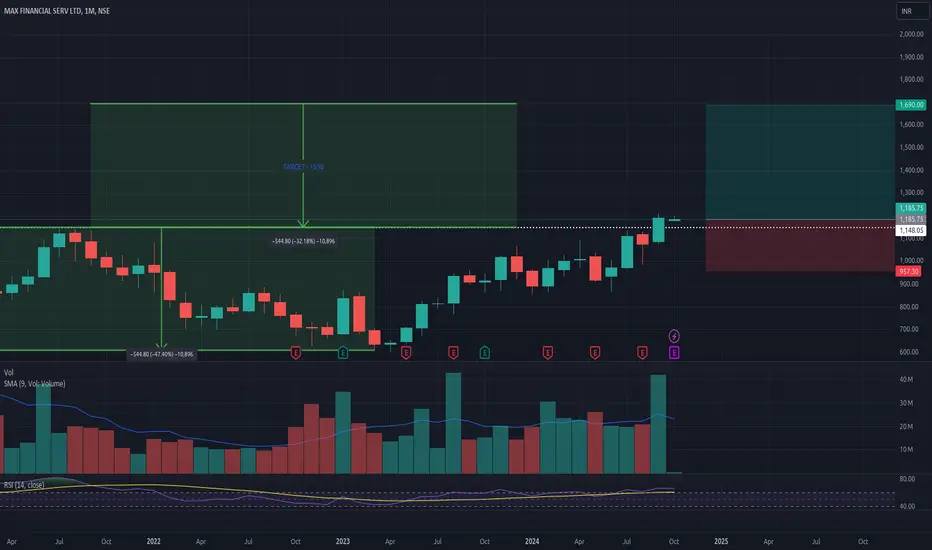
MFSL: Multi-Year Breakout: Monthly Timeframe: Oct 24
- Stock broke the high it made in Jul'21 in Sep'24. A multi-year breakout on a monthly time frame
- RSI is just above 60 - Indicating good buy demand
[x] Breakout in Sep happened with above average trade volume (9 SMA) - Entry and y'day 01-Oct close @ 1185.75
[x] Target = Breakout level + Drawdown during consolidation phase = 1148 + 545 ~ 1690
[x] Stop Loss = 1 ATR below previous month's low = 957.3
Trade active
Bought at 1184.7 on 03-OctNote
Switching to weekly timeframe to analyze the breakoutDisclaimer
The information and publications are not meant to be, and do not constitute, financial, investment, trading, or other types of advice or recommendations supplied or endorsed by TradingView. Read more in the Terms of Use.
Disclaimer
The information and publications are not meant to be, and do not constitute, financial, investment, trading, or other types of advice or recommendations supplied or endorsed by TradingView. Read more in the Terms of Use.