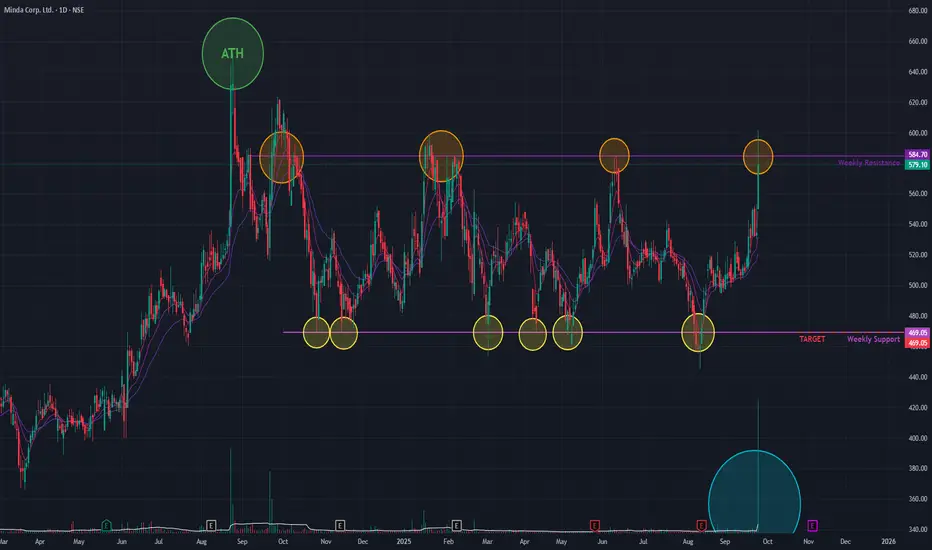
Minda Corp is making a powerful attempt to break out of a prolonged consolidation phase that has been in place since its All-Time High in August 2024. Today, the stock surged +8.34% on the back of exceptionally high trading volume—the largest spike seen in a considerable time.
The stock challenged a major resistance trendline that has been a barrier since September 2024, rejecting multiple breakout attempts. While today's price action breached this level intra-day, it failed to achieve a close above it, signaling that the battle between buyers and sellers at this critical juncture is not yet over.
Broad-Based Bullish Signals 👍
Despite the failed closing, the underlying technical picture is strong, with multiple indicators suggesting a bullish bias:
- Multi-Timeframe Strength: The short-term Exponential Moving Averages (EMAs) and the Relative Strength Index (RSI) are all indicating bullish crossovers on the monthly, weekly, and daily charts.
- Volume Thrust: Today's massive volume spike underscores the significant buying interest at this resistance level, even if it was not enough to secure a close above it.
Outlook: Awaiting a Decisive Close
The stock is at a critical inflection point. A decisive close above the resistance line on high volume is now required to confirm a true breakout.
- Bullish Case 📈: If a confirmed breakout occurs and the momentum is sustained, the next potential target is the resistance zone near ₹701.
- Bearish Case 📉: If the stock is rejected again at this level, it could fall back to the lower end of its consolidation range, with a potential support level near ₹469. The price action in the coming days will be crucial.
Disclaimer: This analysis is my personal view & for educational purposes only. They shall not be construed as trade or investment advice. Before making any financial decision, it is imperative that you consult with a qualified financial professional.
Disclaimer
The information and publications are not meant to be, and do not constitute, financial, investment, trading, or other types of advice or recommendations supplied or endorsed by TradingView. Read more in the Terms of Use.